Trifacta
Jobs Results and Monitoring
Trifacta, a leader in data preparation, helps users transform raw data into structured insights. As the company evolved toward automation and scalability, efficient data pipeline monitoring became crucial. This case study explores how we tackled real-time data transformation monitoring—enhancing transparency and making it easier for users to identify and resolve issues before they impact operations.
Context
The successful analysis relies upon accurate, well-structured data that has been formatted for the specific task at hand. Data preparation is the process you must undergo to transition raw data source inputs into prepared outputs to be utilized in analysis, reporting, and data science.
Analysis and understanding
At Trifacta, customer needs shape our product direction. The Customer Success Management (CSM) team—Customer Success Managers, Solutions Architects, and Technical Support—provides critical real-world insights that the UX team relies on to gather qualitative data.
One key research method is shadowing CSM sessions, allowing us to observe users naturally and uncover pain points without interference. My focus during these sessions was identifying opportunities for automation and operational improvements, particularly in job execution and results. Recurring issues included:
- Difficulty finding job result downloads (Wrangler Free, Cloud Dataprep).
- Accidental clicks on "Create a Dataset" instead of downloading/publishing output.
- Confusion between ad-hoc and run-job publishing functionalities.
- Lack of transparency on job status and poor system feedback.
- Job logs being too complex for non-technical users.
To dive deeper, I conducted follow-up interviews with questions like: What do users need to know about their jobs while running?
What job-related information is most valuable post-completion? What are they trying to accomplish on the job results page?
By synthesizing insights from shadowing, recordings, and interviews, we identified clear usability patterns, guiding improvements to the Job Results experience and overall product usability.
These discoveries laid the foundation for the Job Results Project.
Problem
The lack of transparency around job status—when, how, and why a job runs—created a major trust issue. Data analysts faced unnecessary friction when working on complex data transformation projects. They struggled to locate assets, had to painstakingly inspect lengthy and uncertain recipes, and found it difficult to contextualize their results.
My responsibilities
Conduct user research through journey mapping, feedback analysis, and interviews. Define and communicate product vision to stakeholders. Support a team of six developers and one product manager by testing prototypes, delivering Sketch mockups, and documentation.
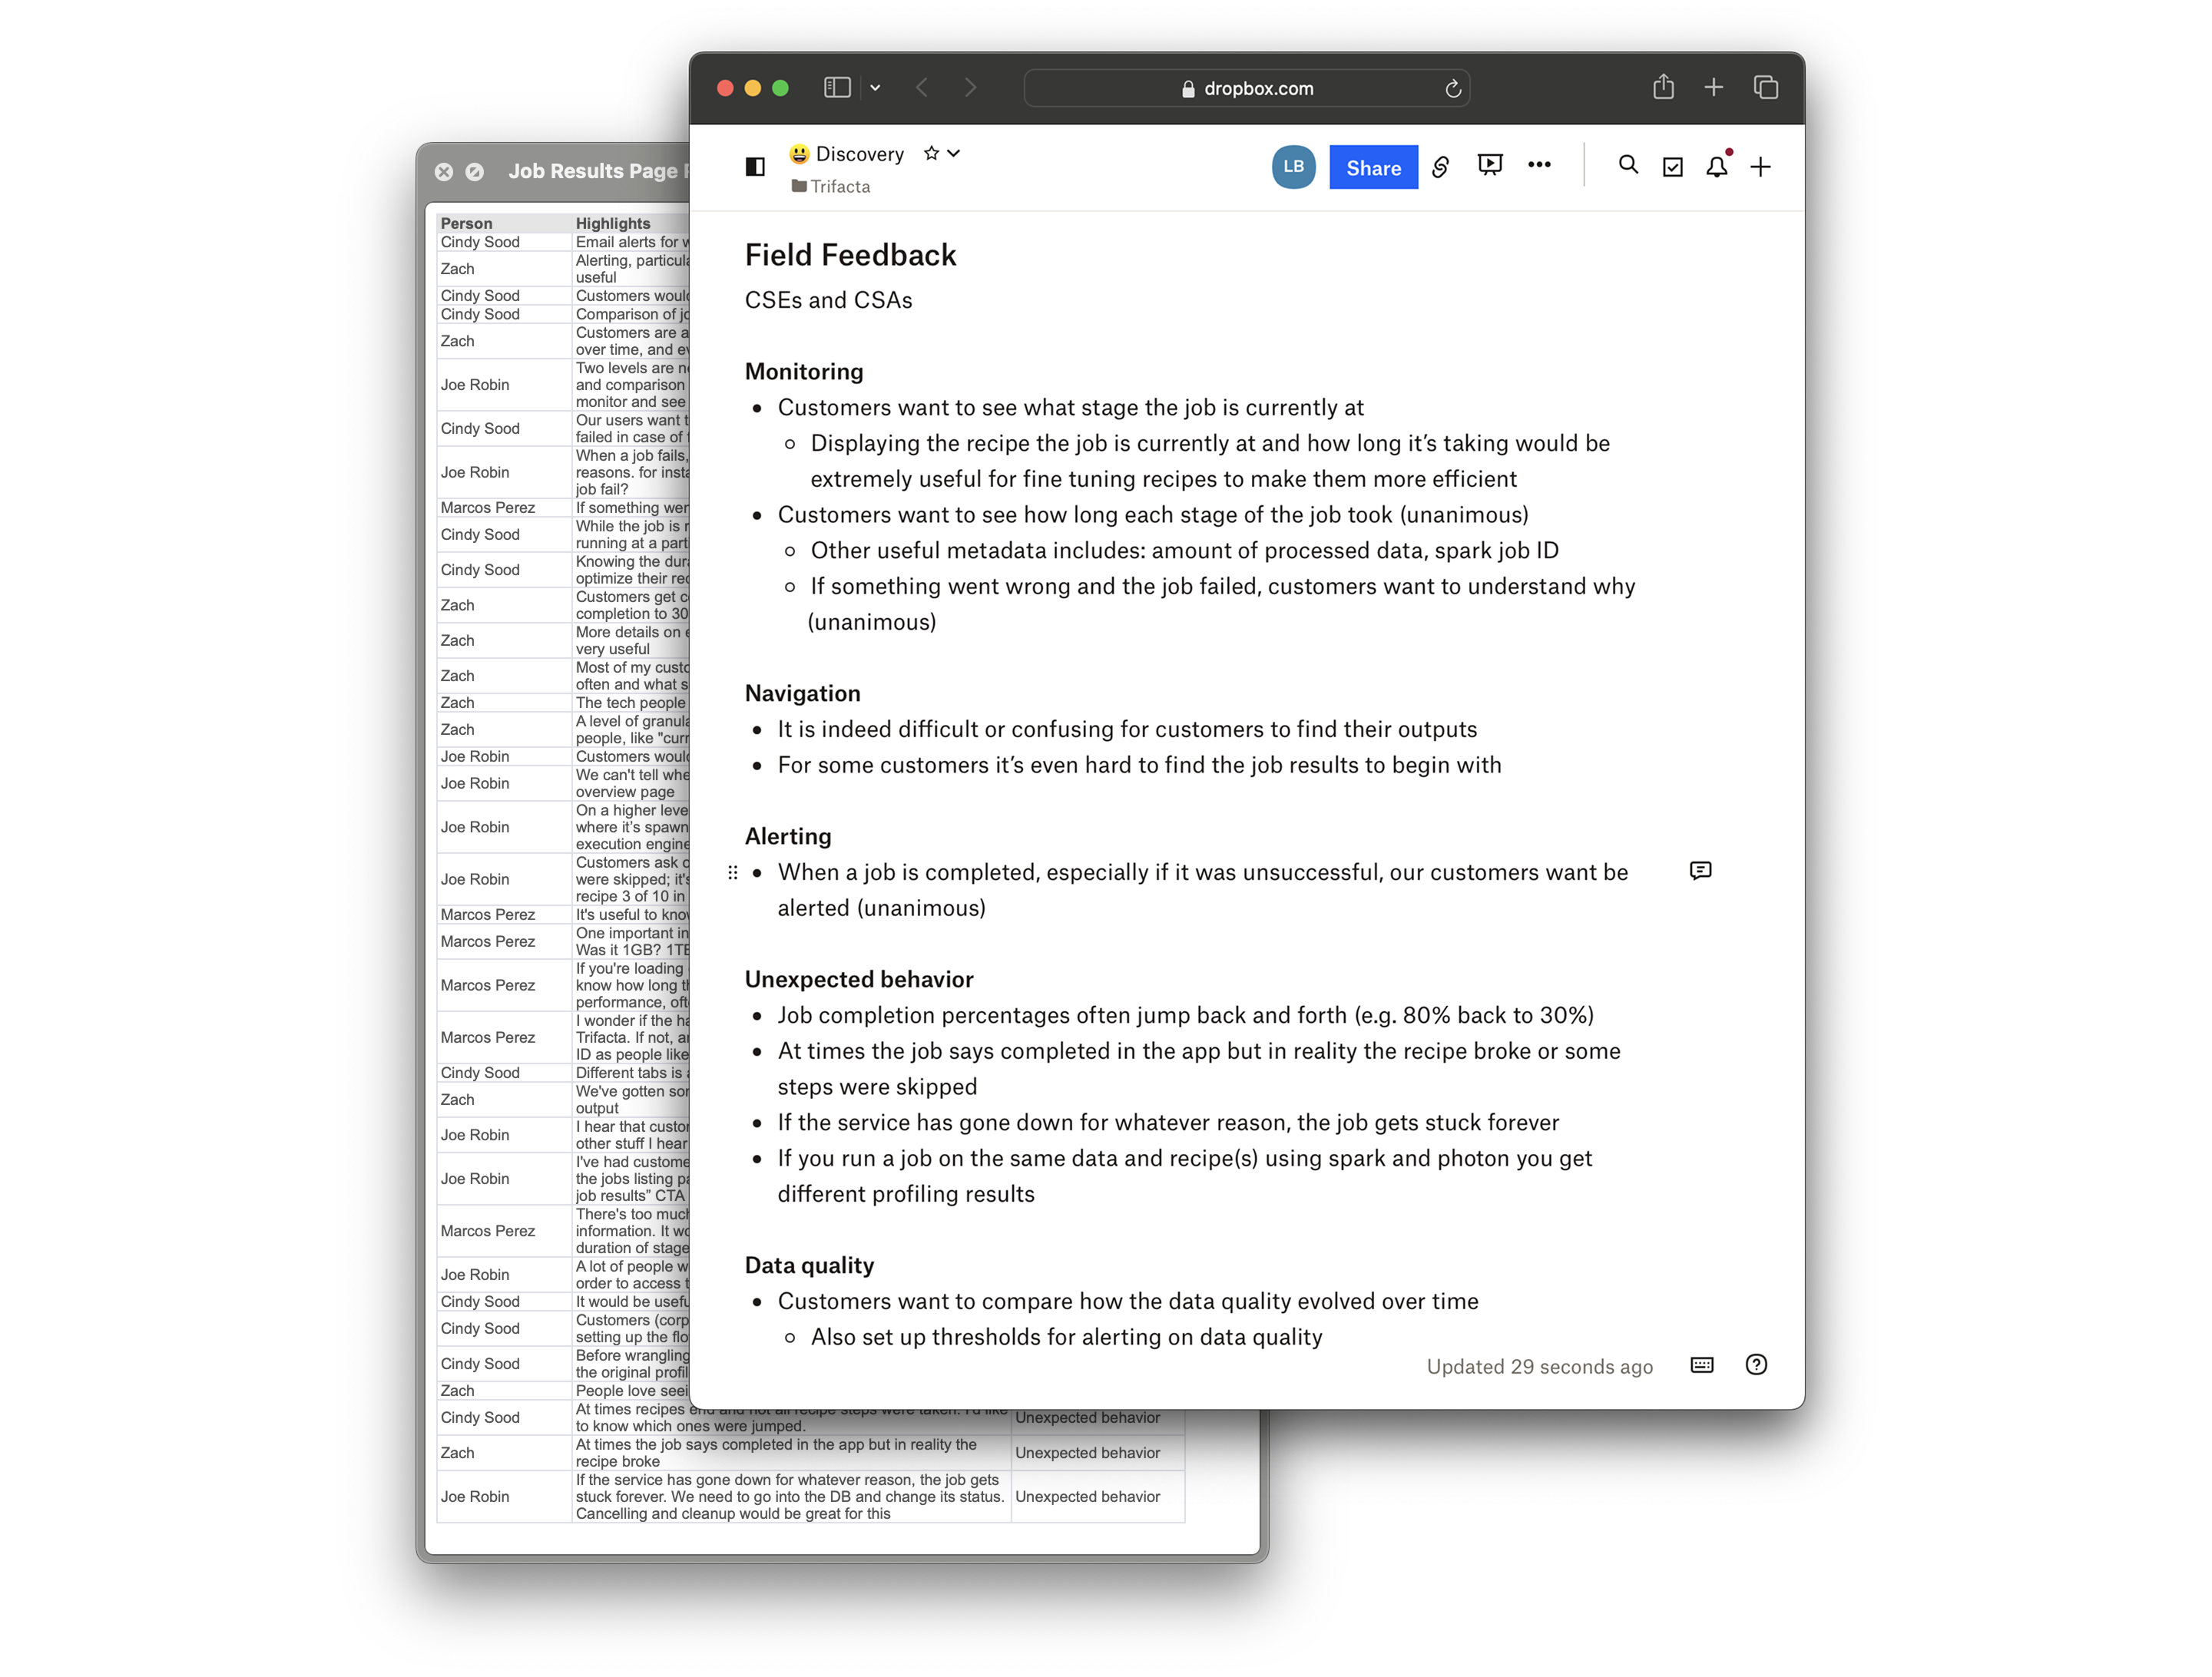
Key goals and possible solution
With field feedback in mind, this project focuses on addressing monitoring and navigation needs, setting the stage for future expansion.
Key areas of focus:
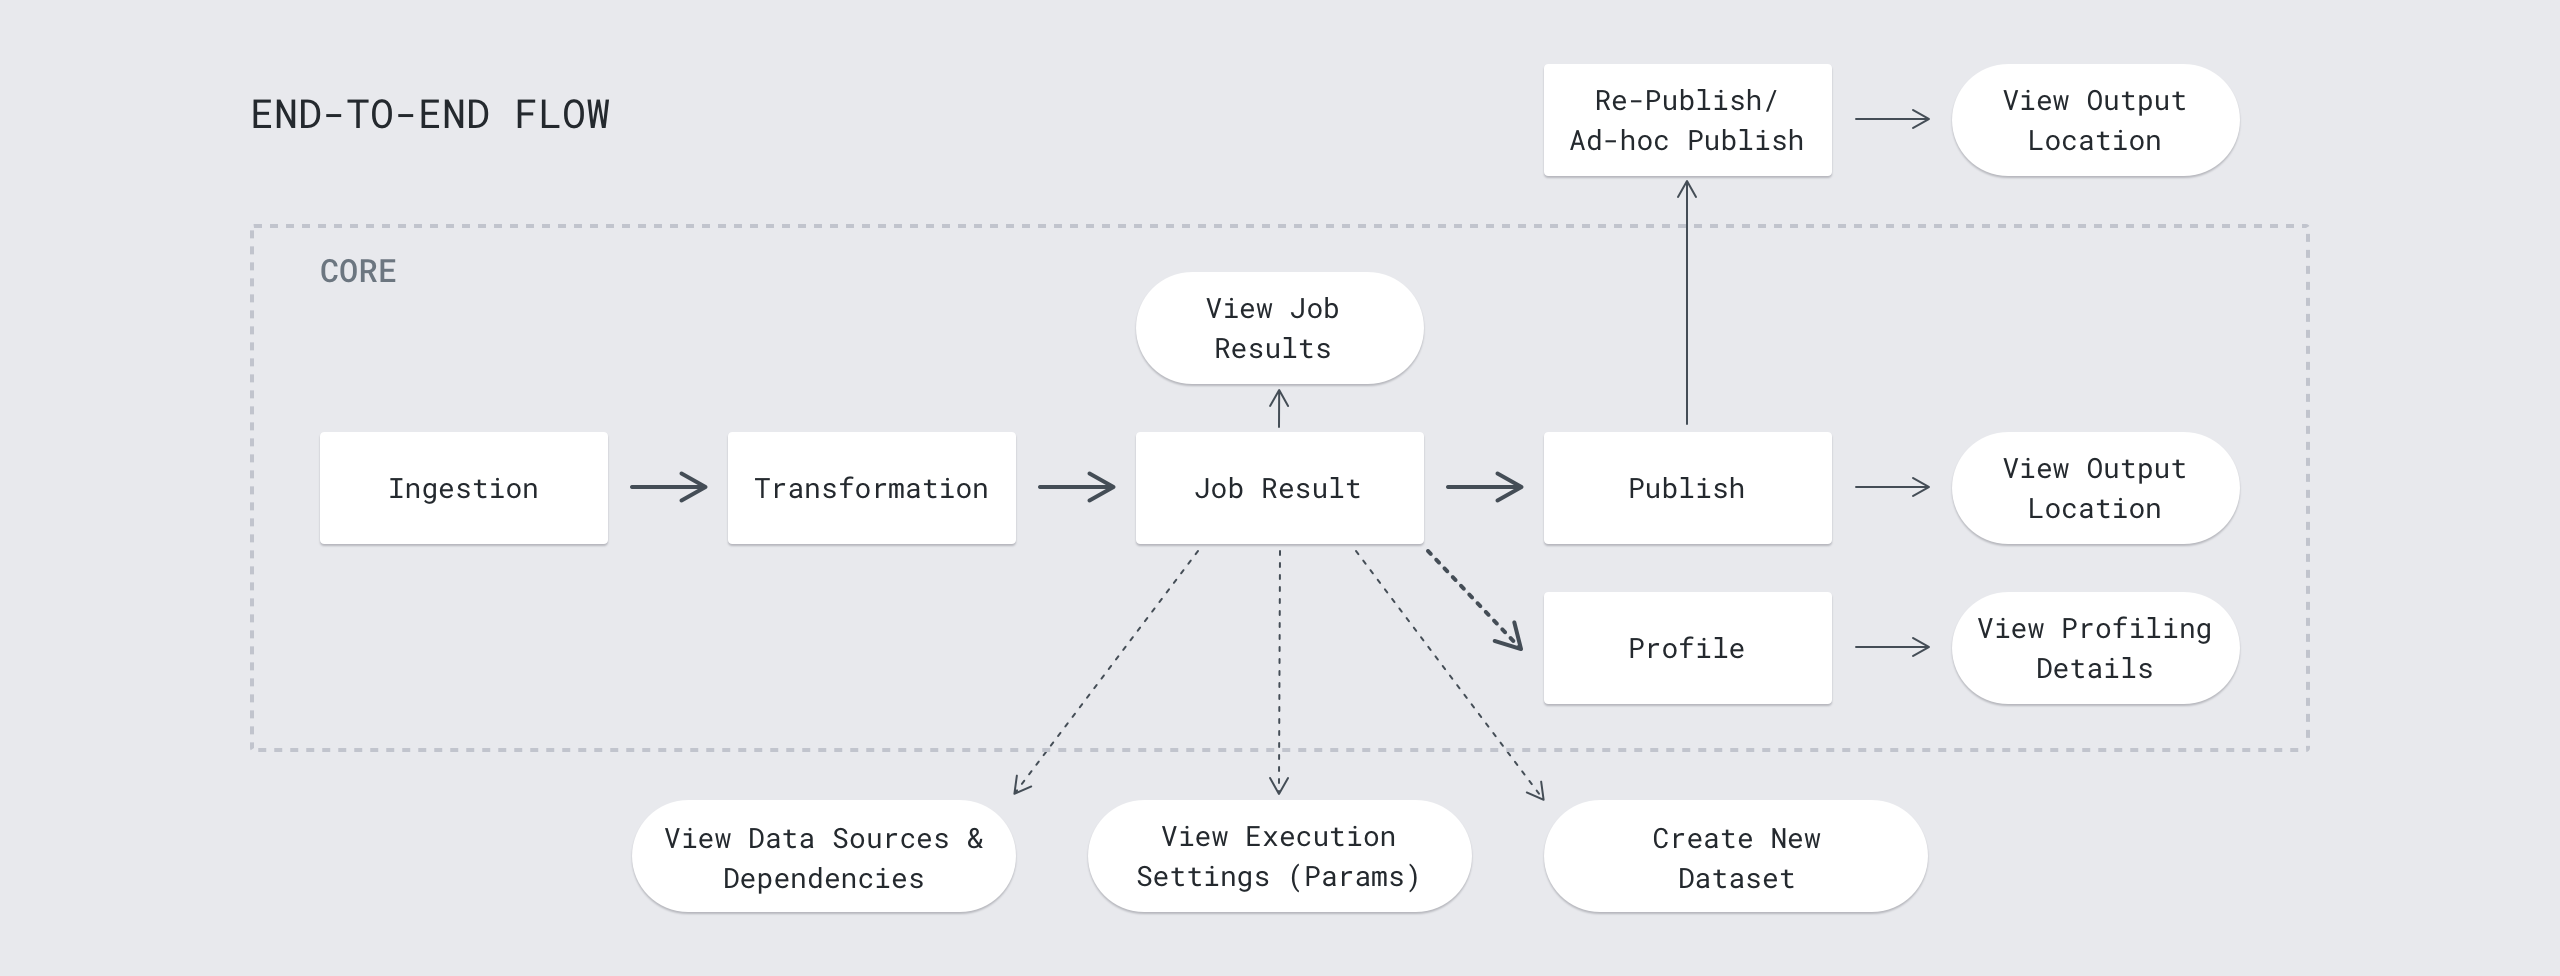
- Structural visualization: Keep stakeholders informed of trends and feedback.
- Storytelling with cross-linking: Improve discoverability without deep drill-downs.
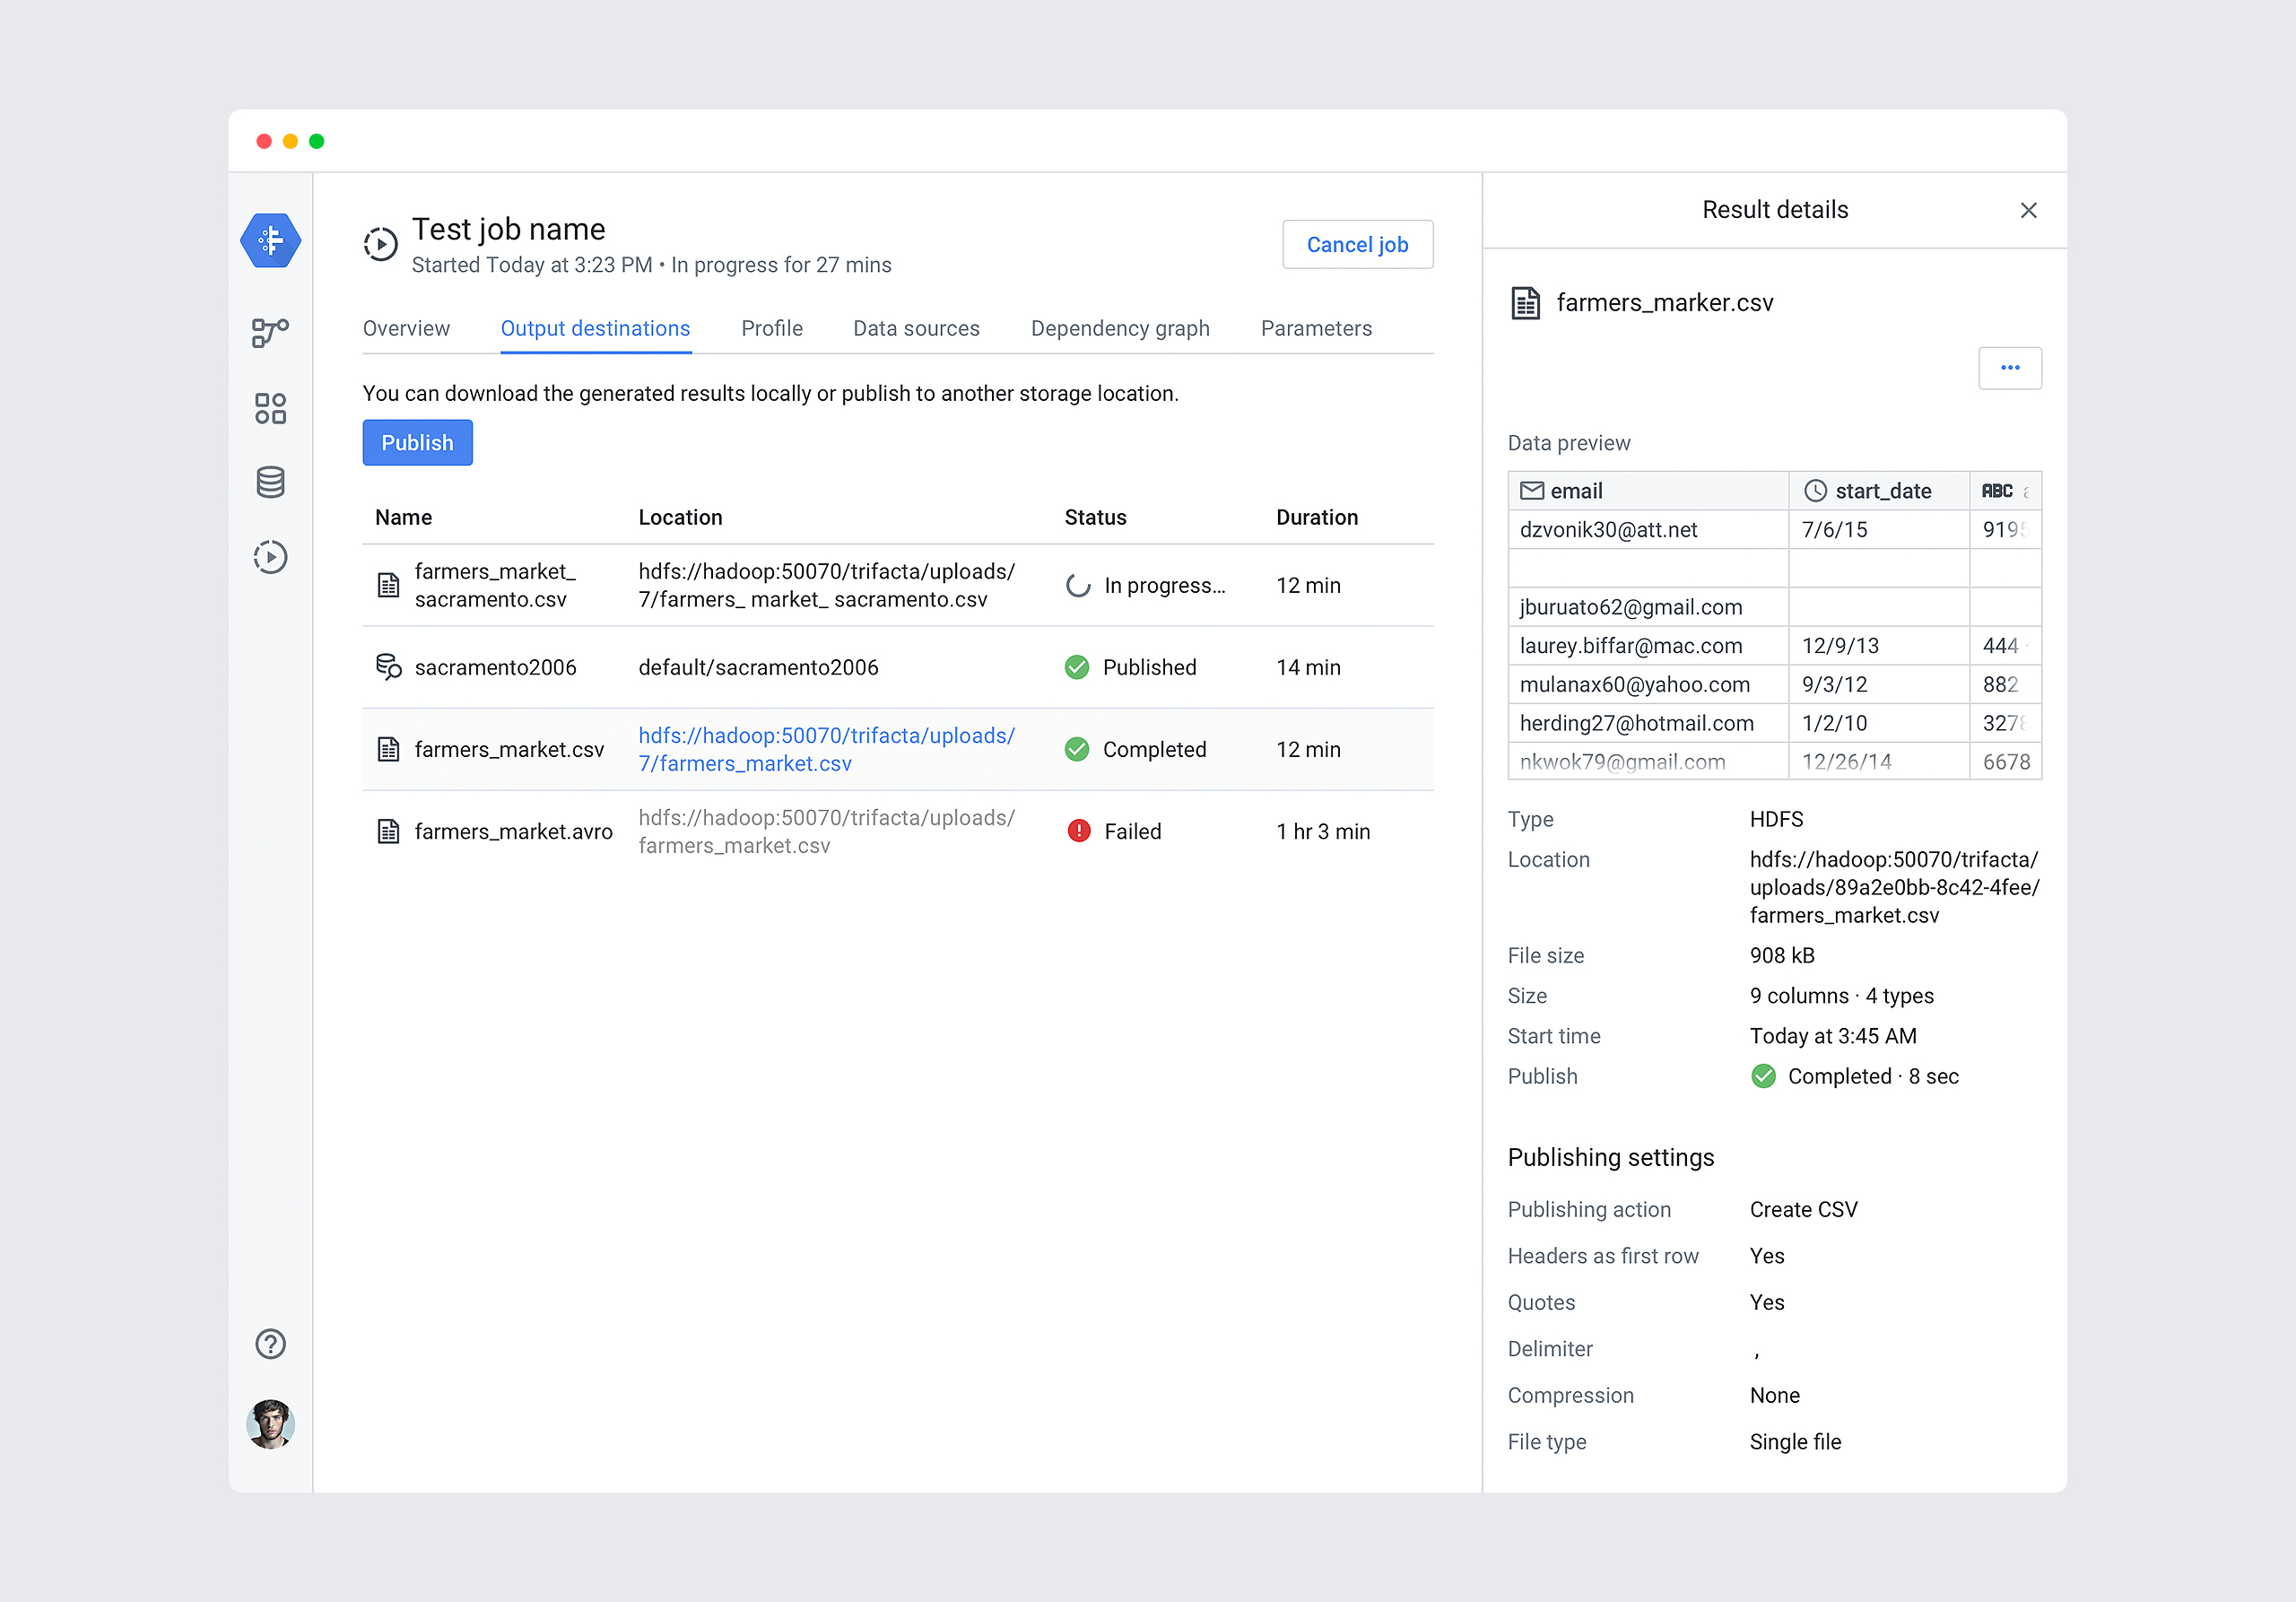
- Job execution/results management: Enable deletion, publishing, and downloads.
The monitoring dashboard concept meets users' needs by providing job status updates and relevant information on a single screen.
Assumptions: Monitoring/overview serves multiple purposes and audiences:
- As a management tool: To track and evaluate job execution progress.
- As a communication tool: To support learning and improvement through alerts and regular updates, informing necessary changes.
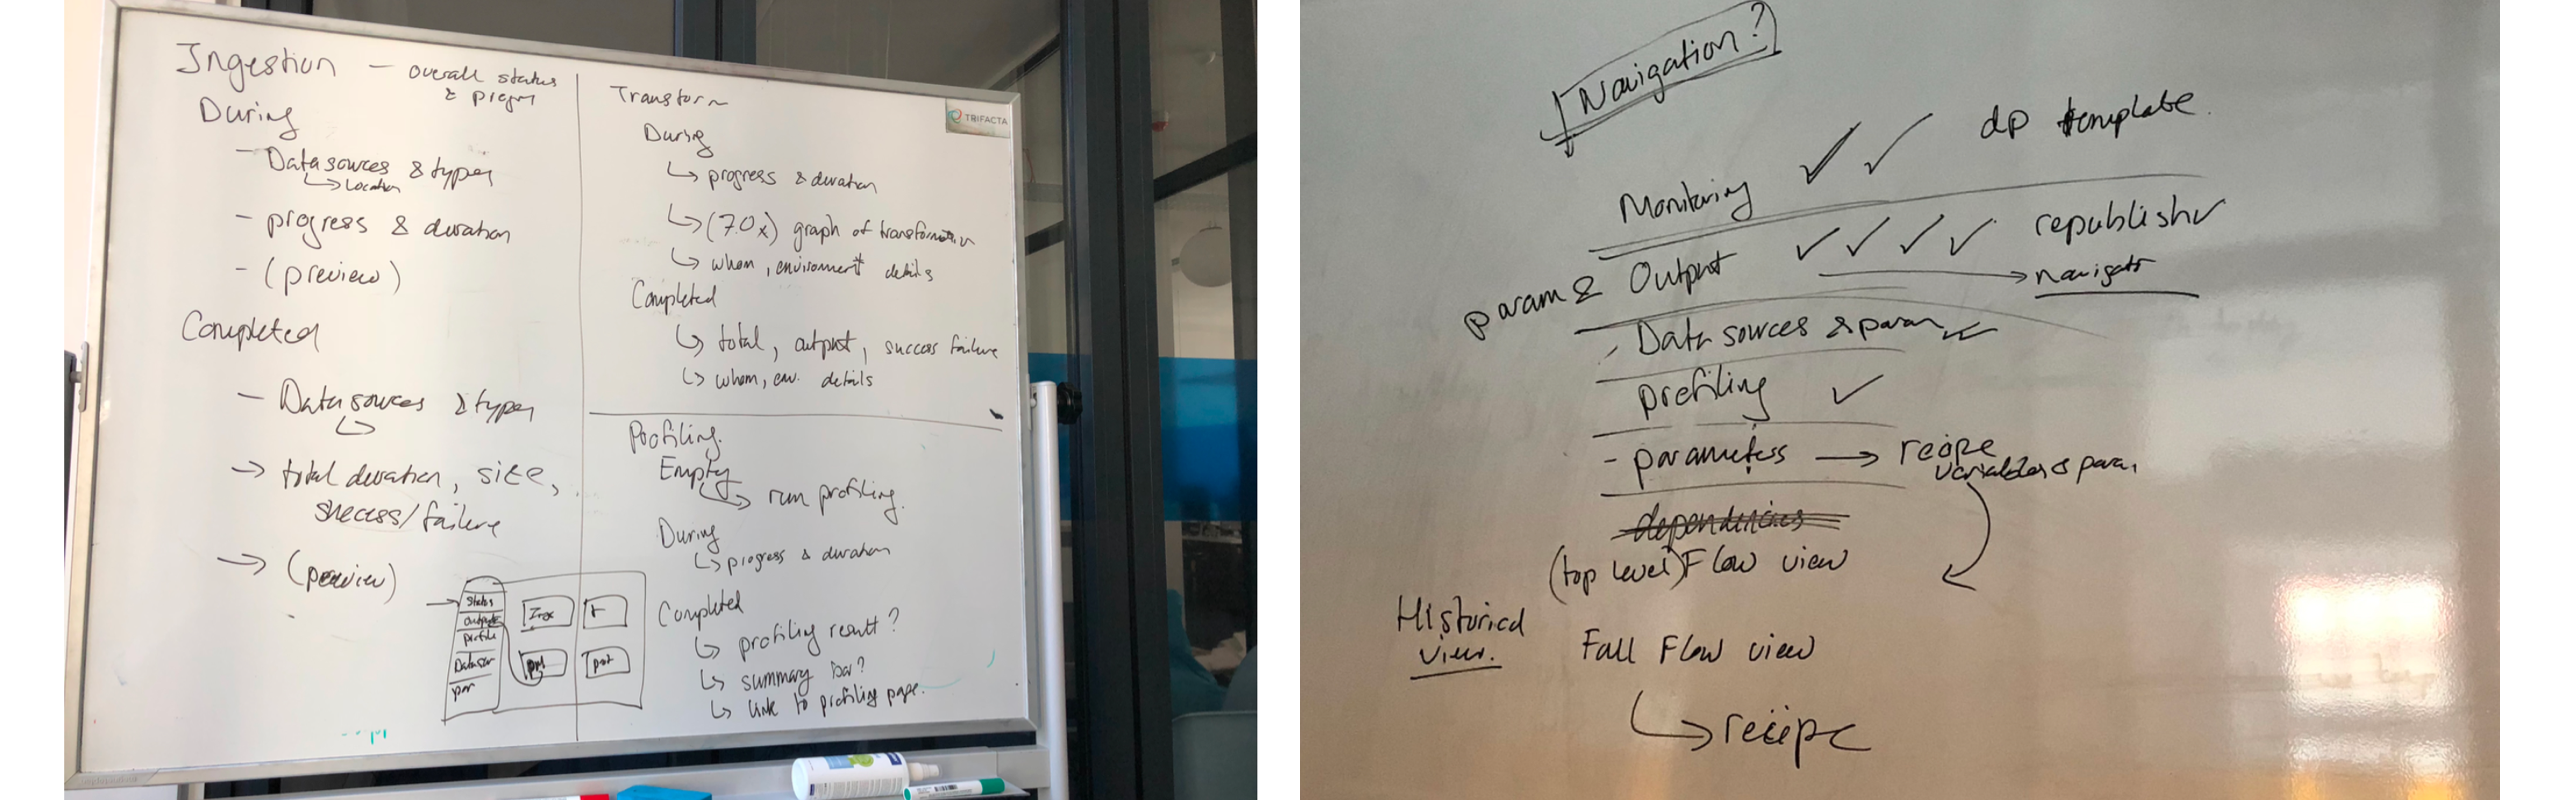
Form meets function
Design is a quest to align the user’s mental model—the way they naturally think about a task—with the conceptual model presented through the product. At Trifacta, this always involves a technical component.
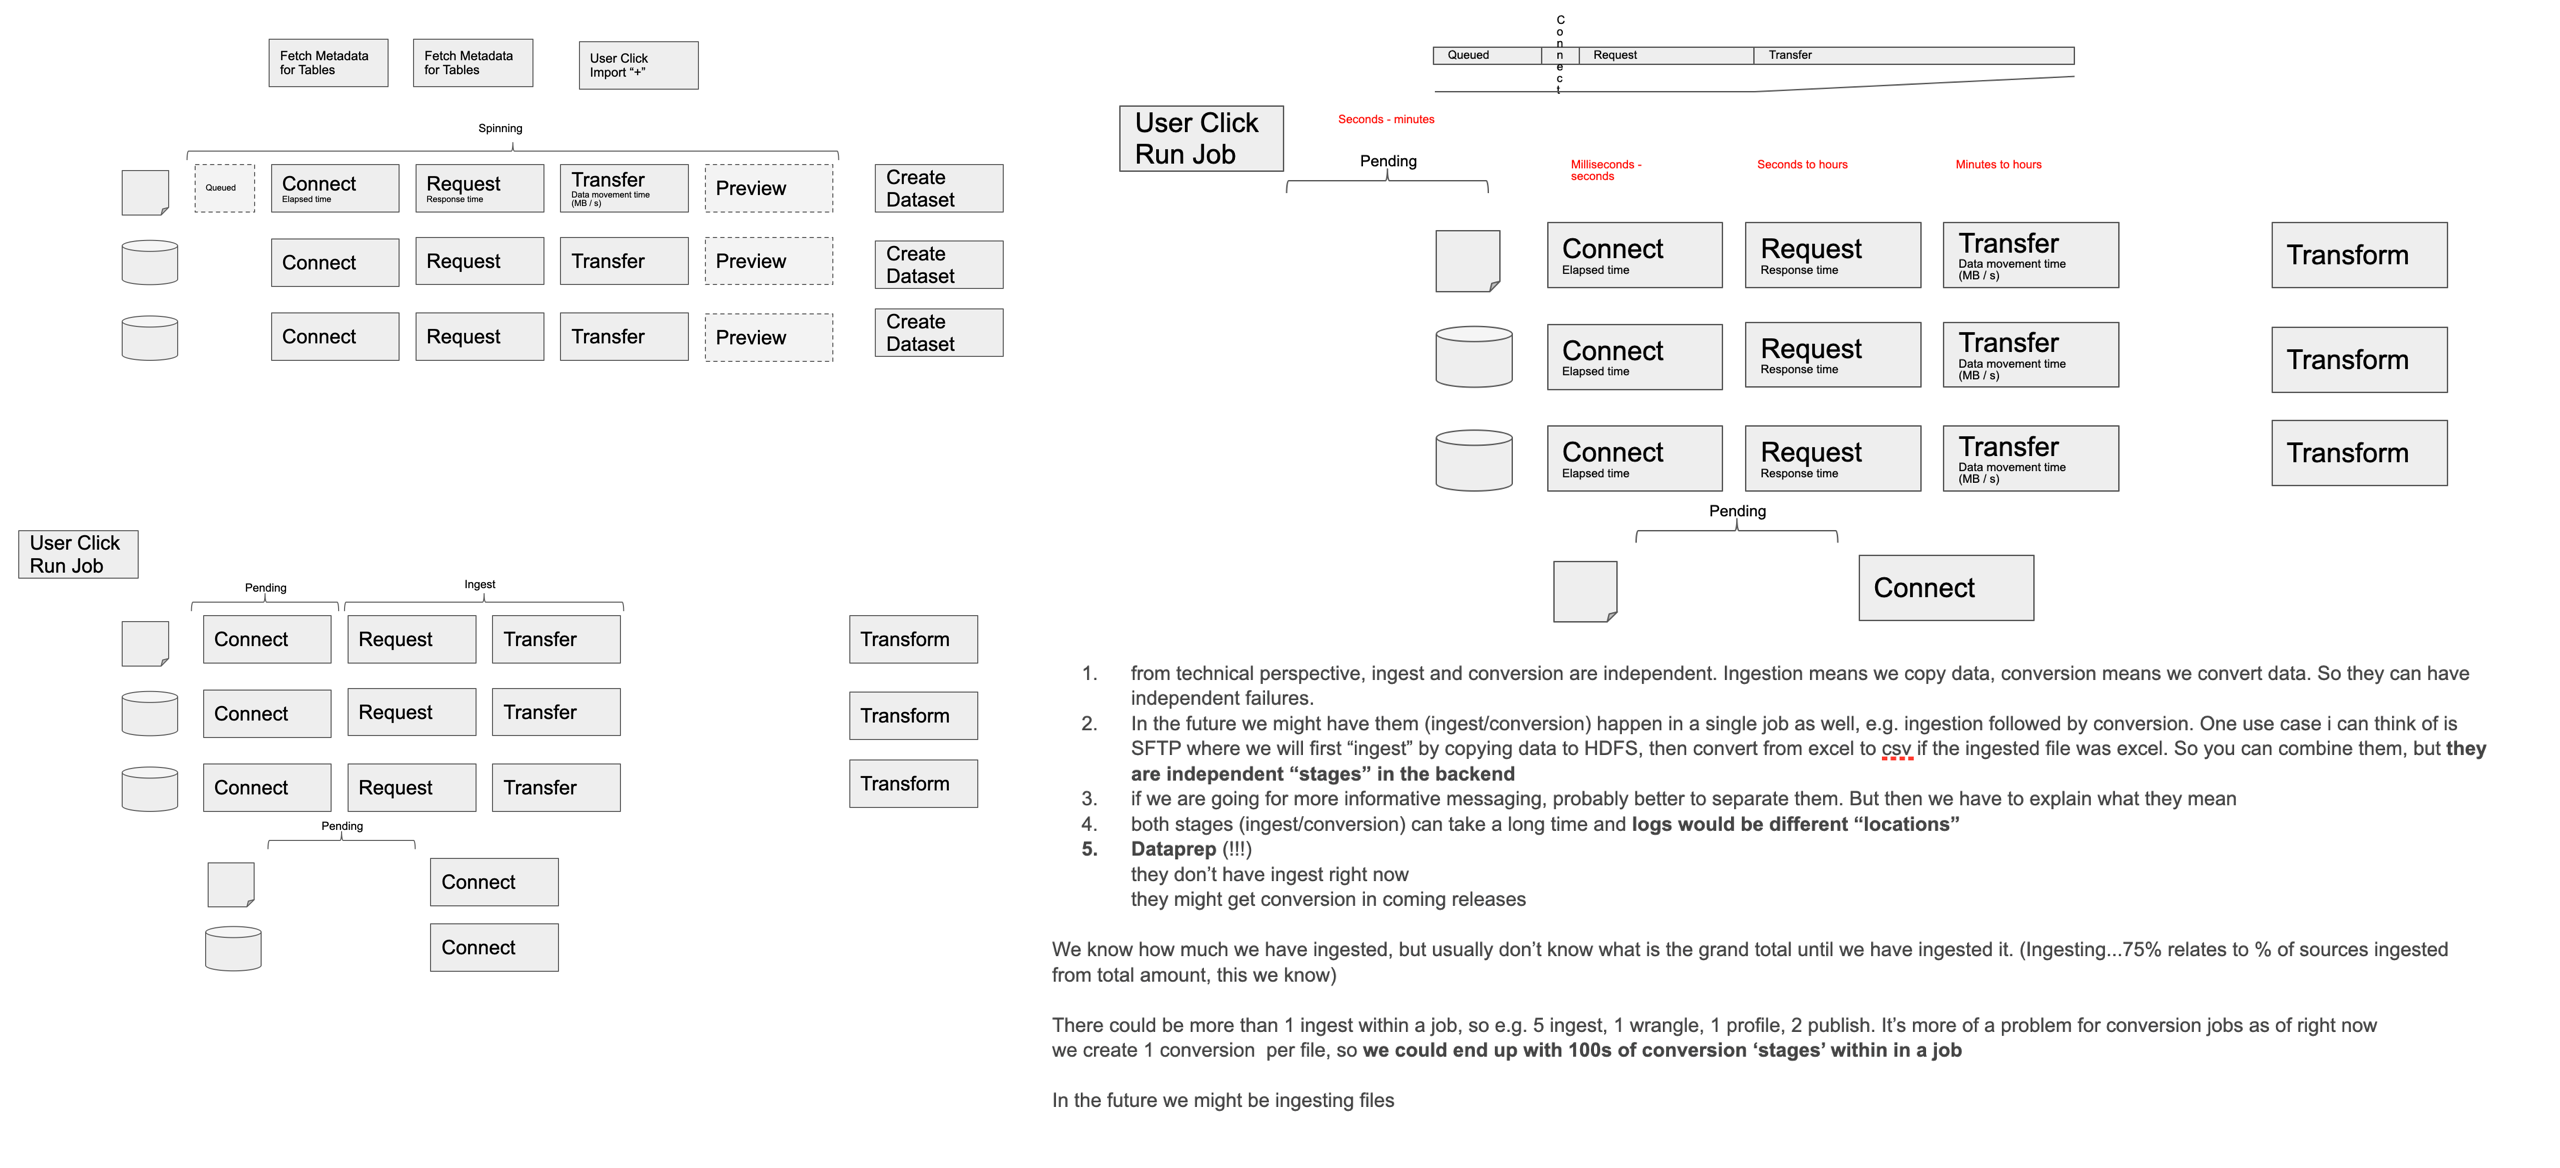
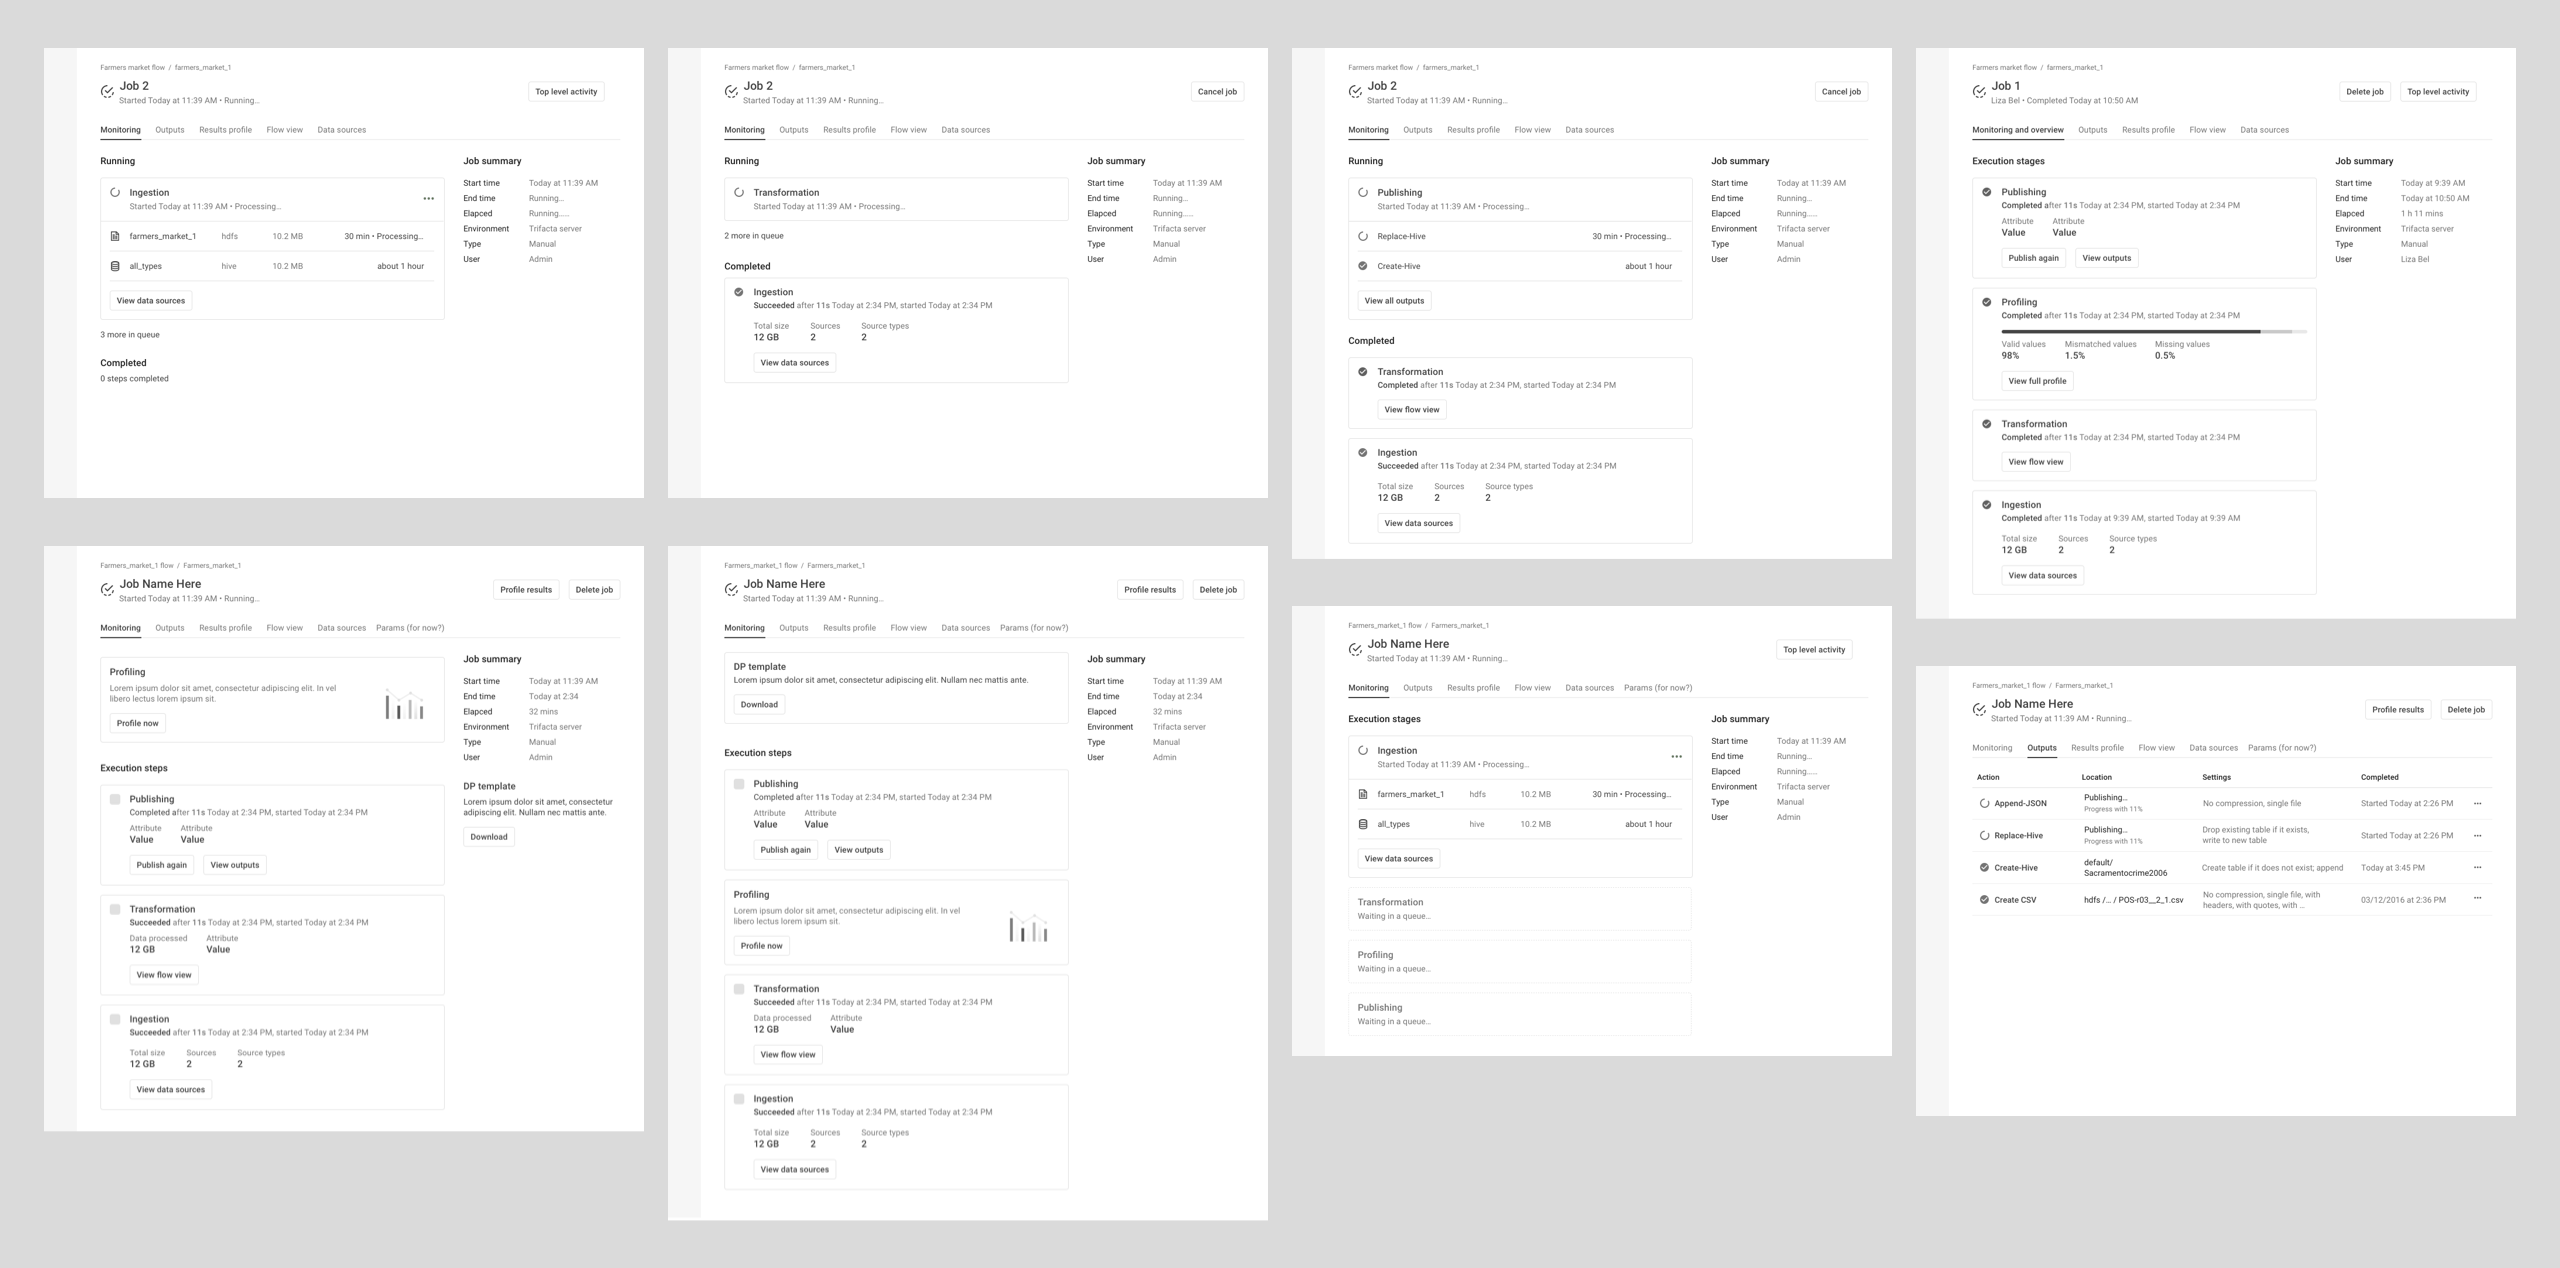
As a product designer, I enjoy navigating functional constraints and uncertainties, as they add another layer of conceptual model validation. Below is a glimpse into my workshops with developers, where we explored how future designs should align with job run functionality.
Layout
I envisioned a visual display that consolidates key information onto a single screen, enabling users to monitor data at a glance and take action when needed. The goal is to facilitate decision-making through clear, real-time insights.
Dashboard-Like Design Principles:
- Enables direct comparison of data without switching between screens.
- Focuses only on critical information for status updates, progress tracking, and performance evaluation.
- Supports drill-down capabilities for timely interventions and historical data retrieval.
- Engages users with an intuitive, performance-tracking experience.
Two Key States:
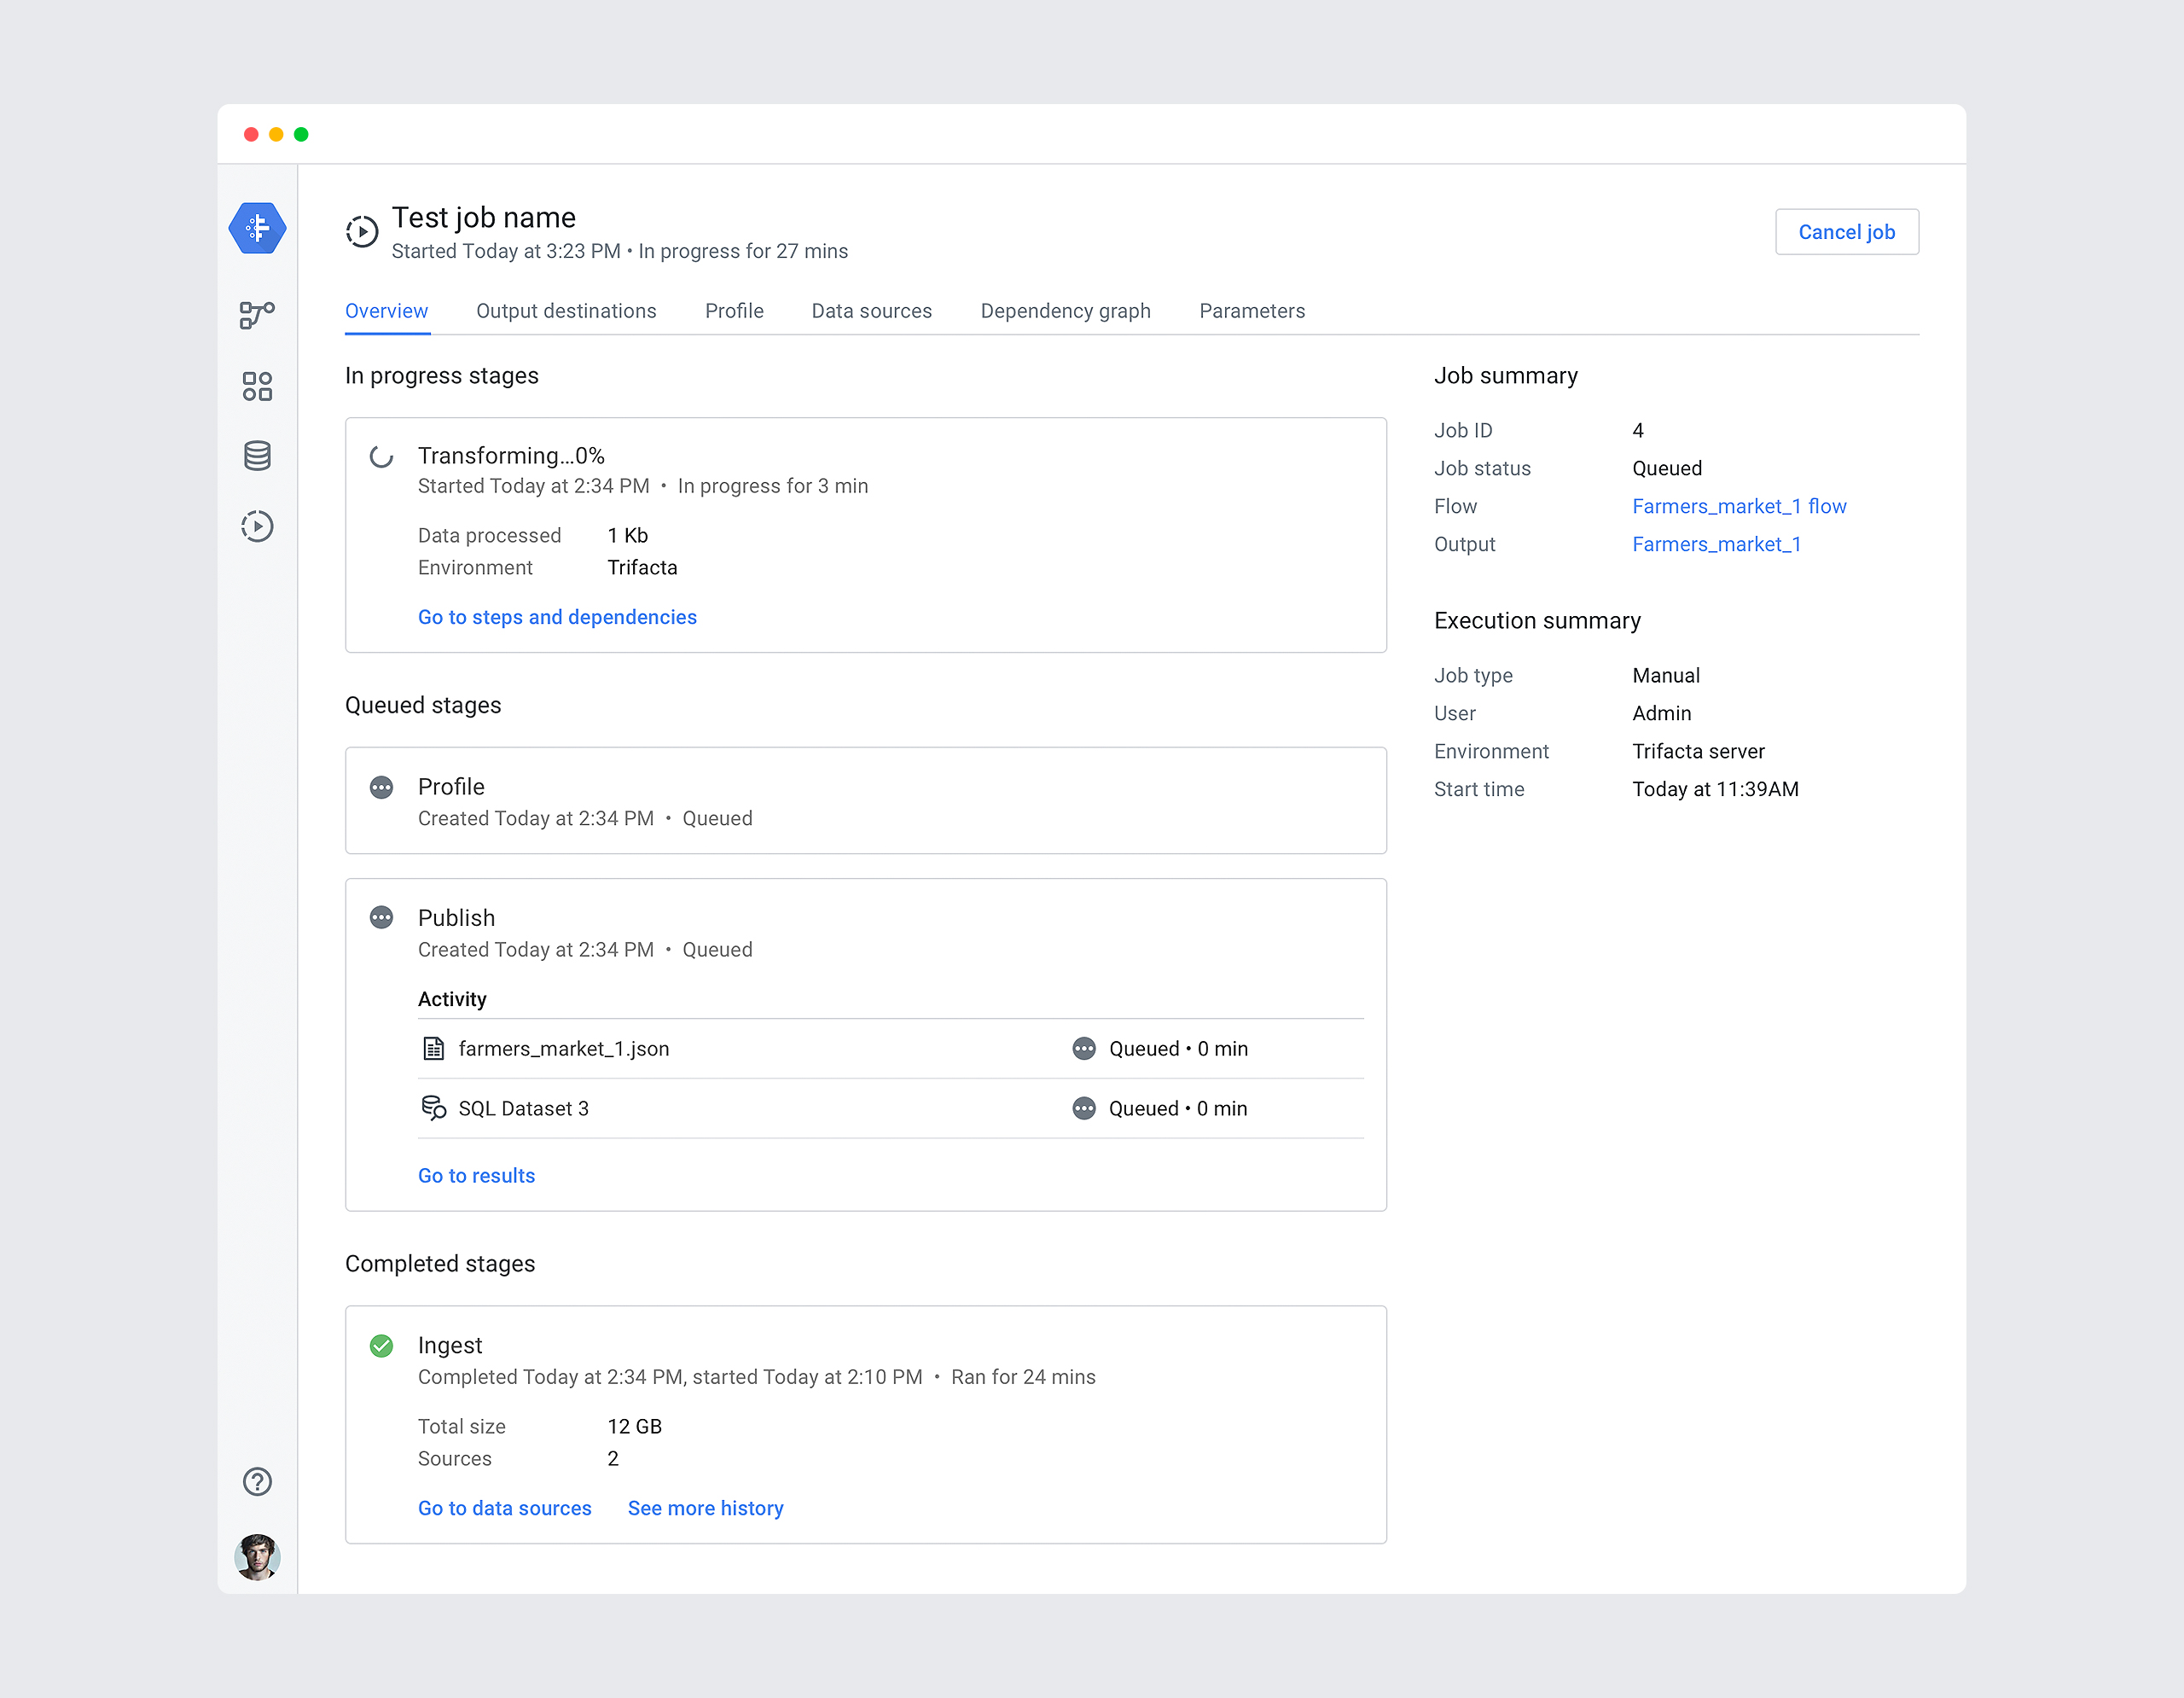
- Dynamic View – Continuously updates in real time for live monitoring.
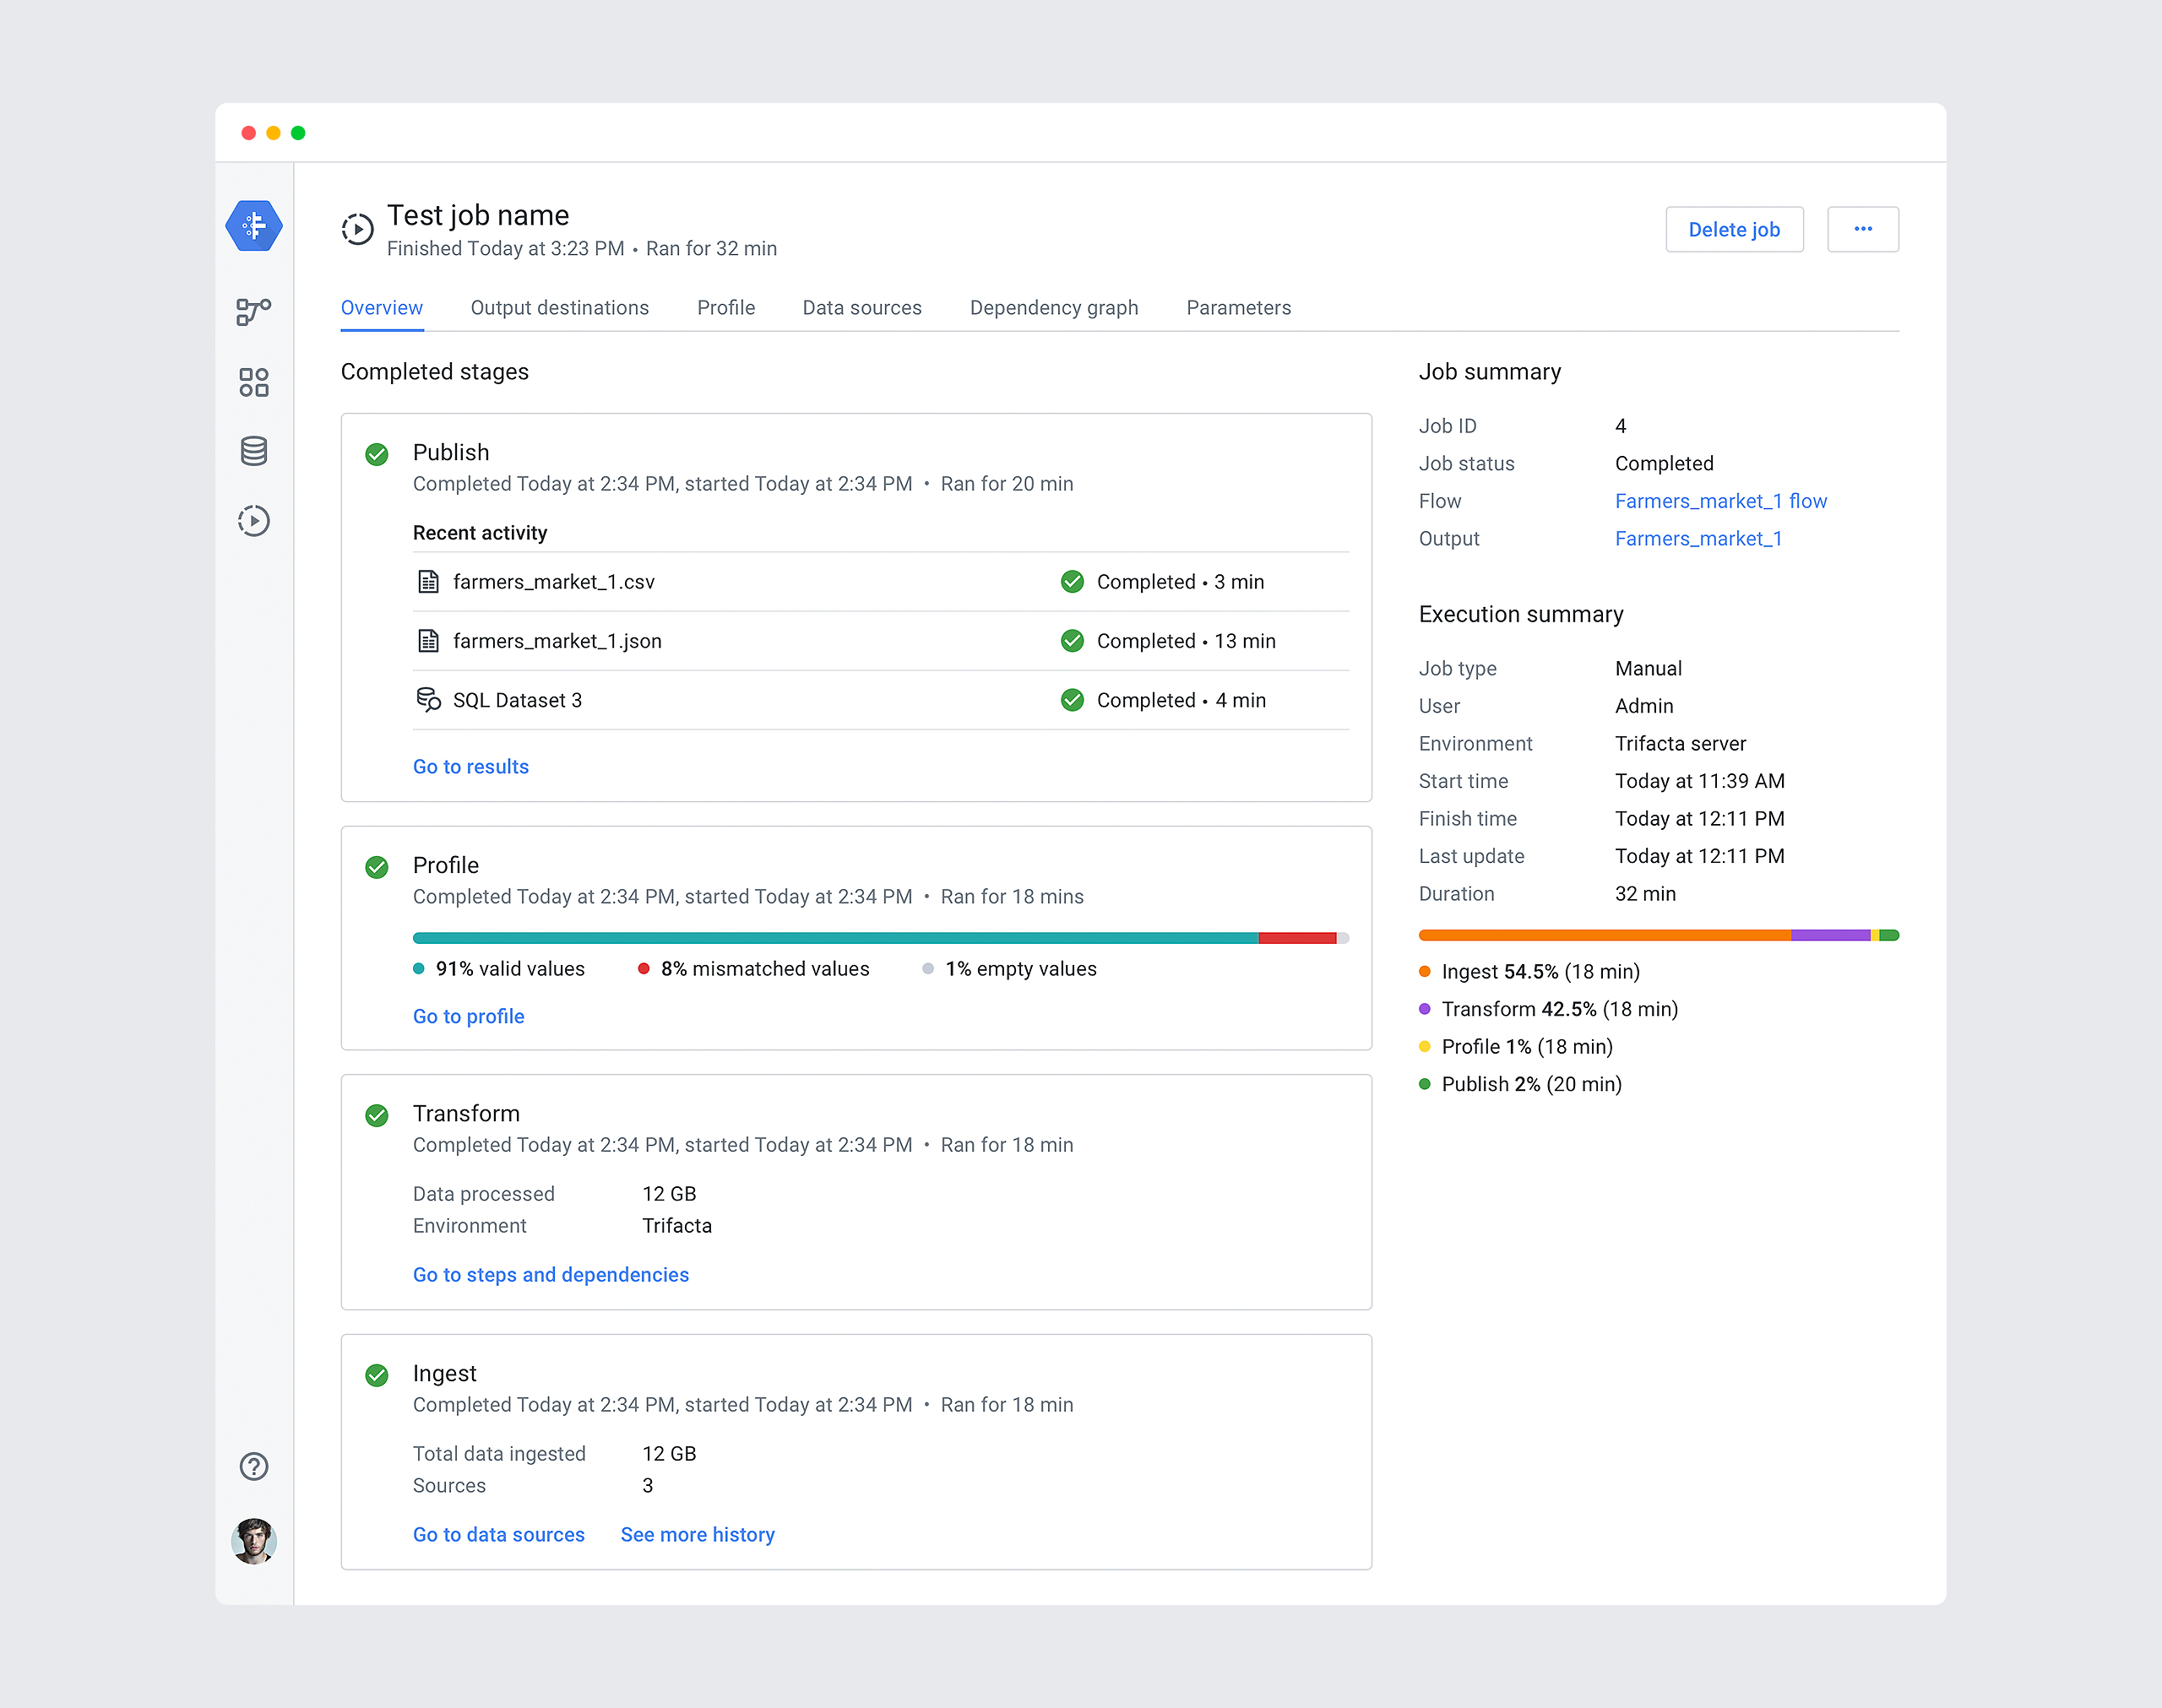
- Static View – Provides a high-level snapshot to highlight trends and patterns.
Overview Design Concepts:
Another key consideration for the chosen overview layout was how the customer experience evolved over time. Users lacked engagement with running jobs due to the absence of monitoring and analysis tools. My main goal was to improve storytelling and structural visualization across all job statuses—presenting the big picture in a clear, intuitive way while ensuring timely insights into patterns and trends.
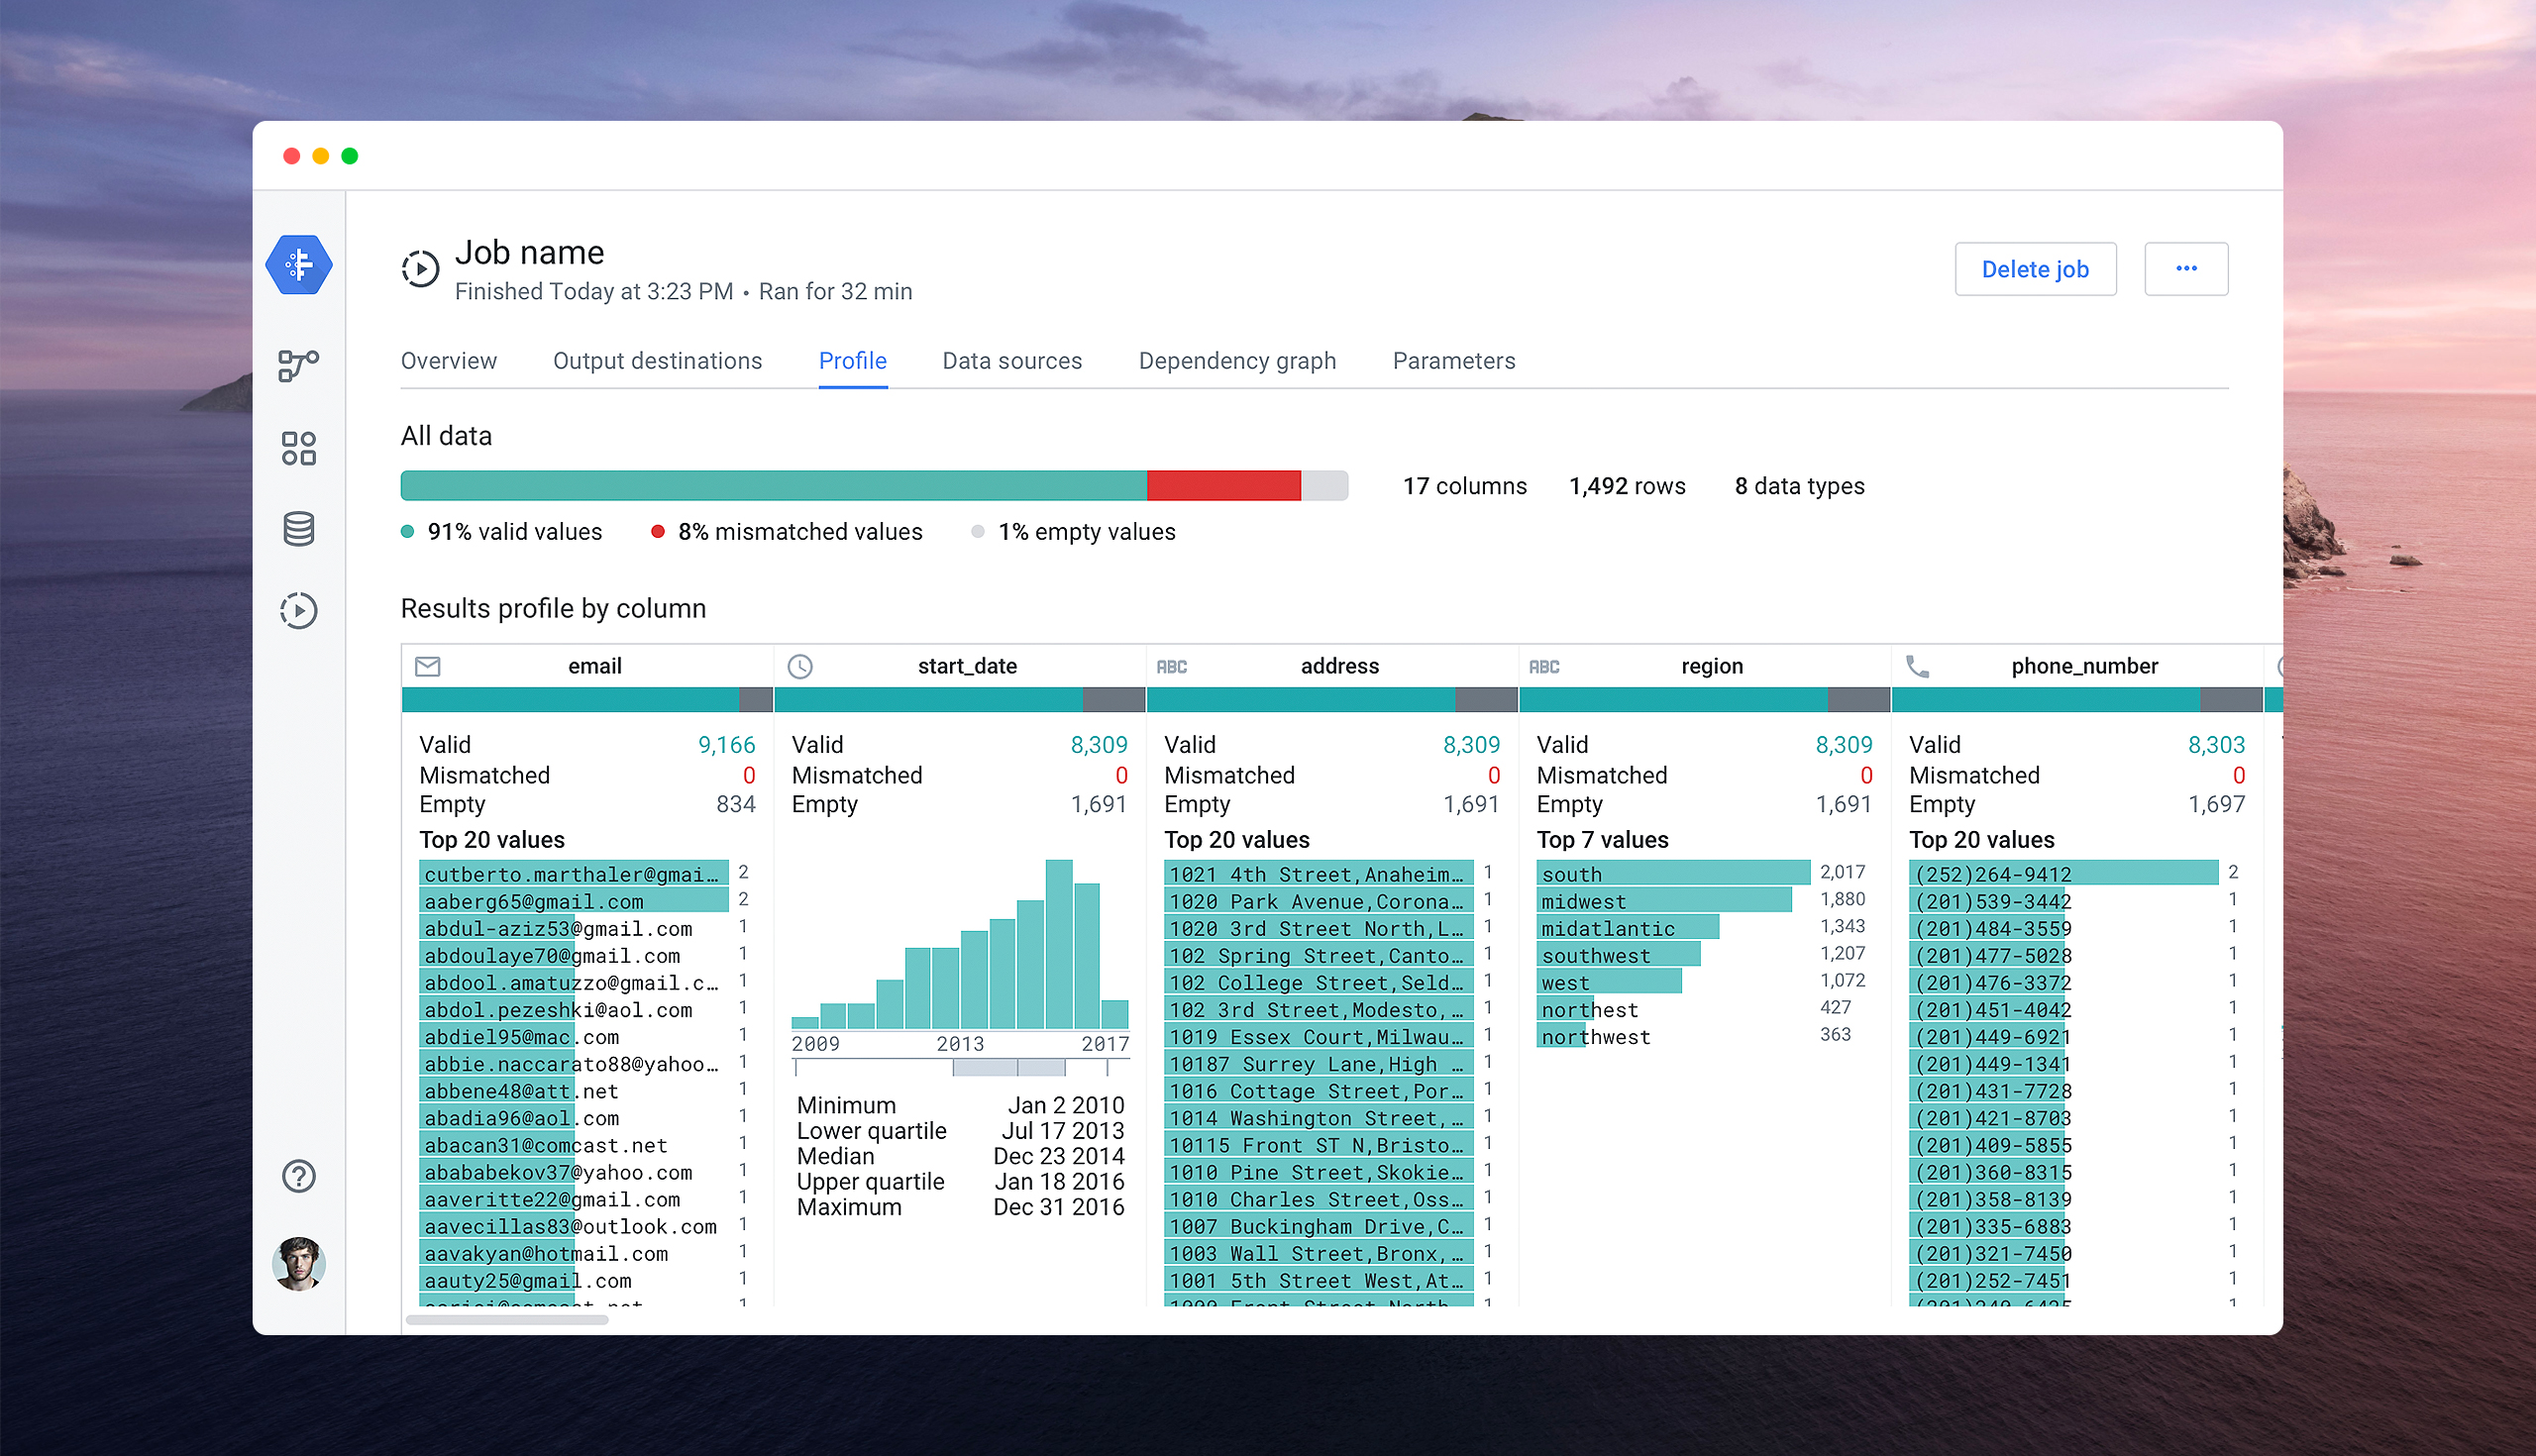
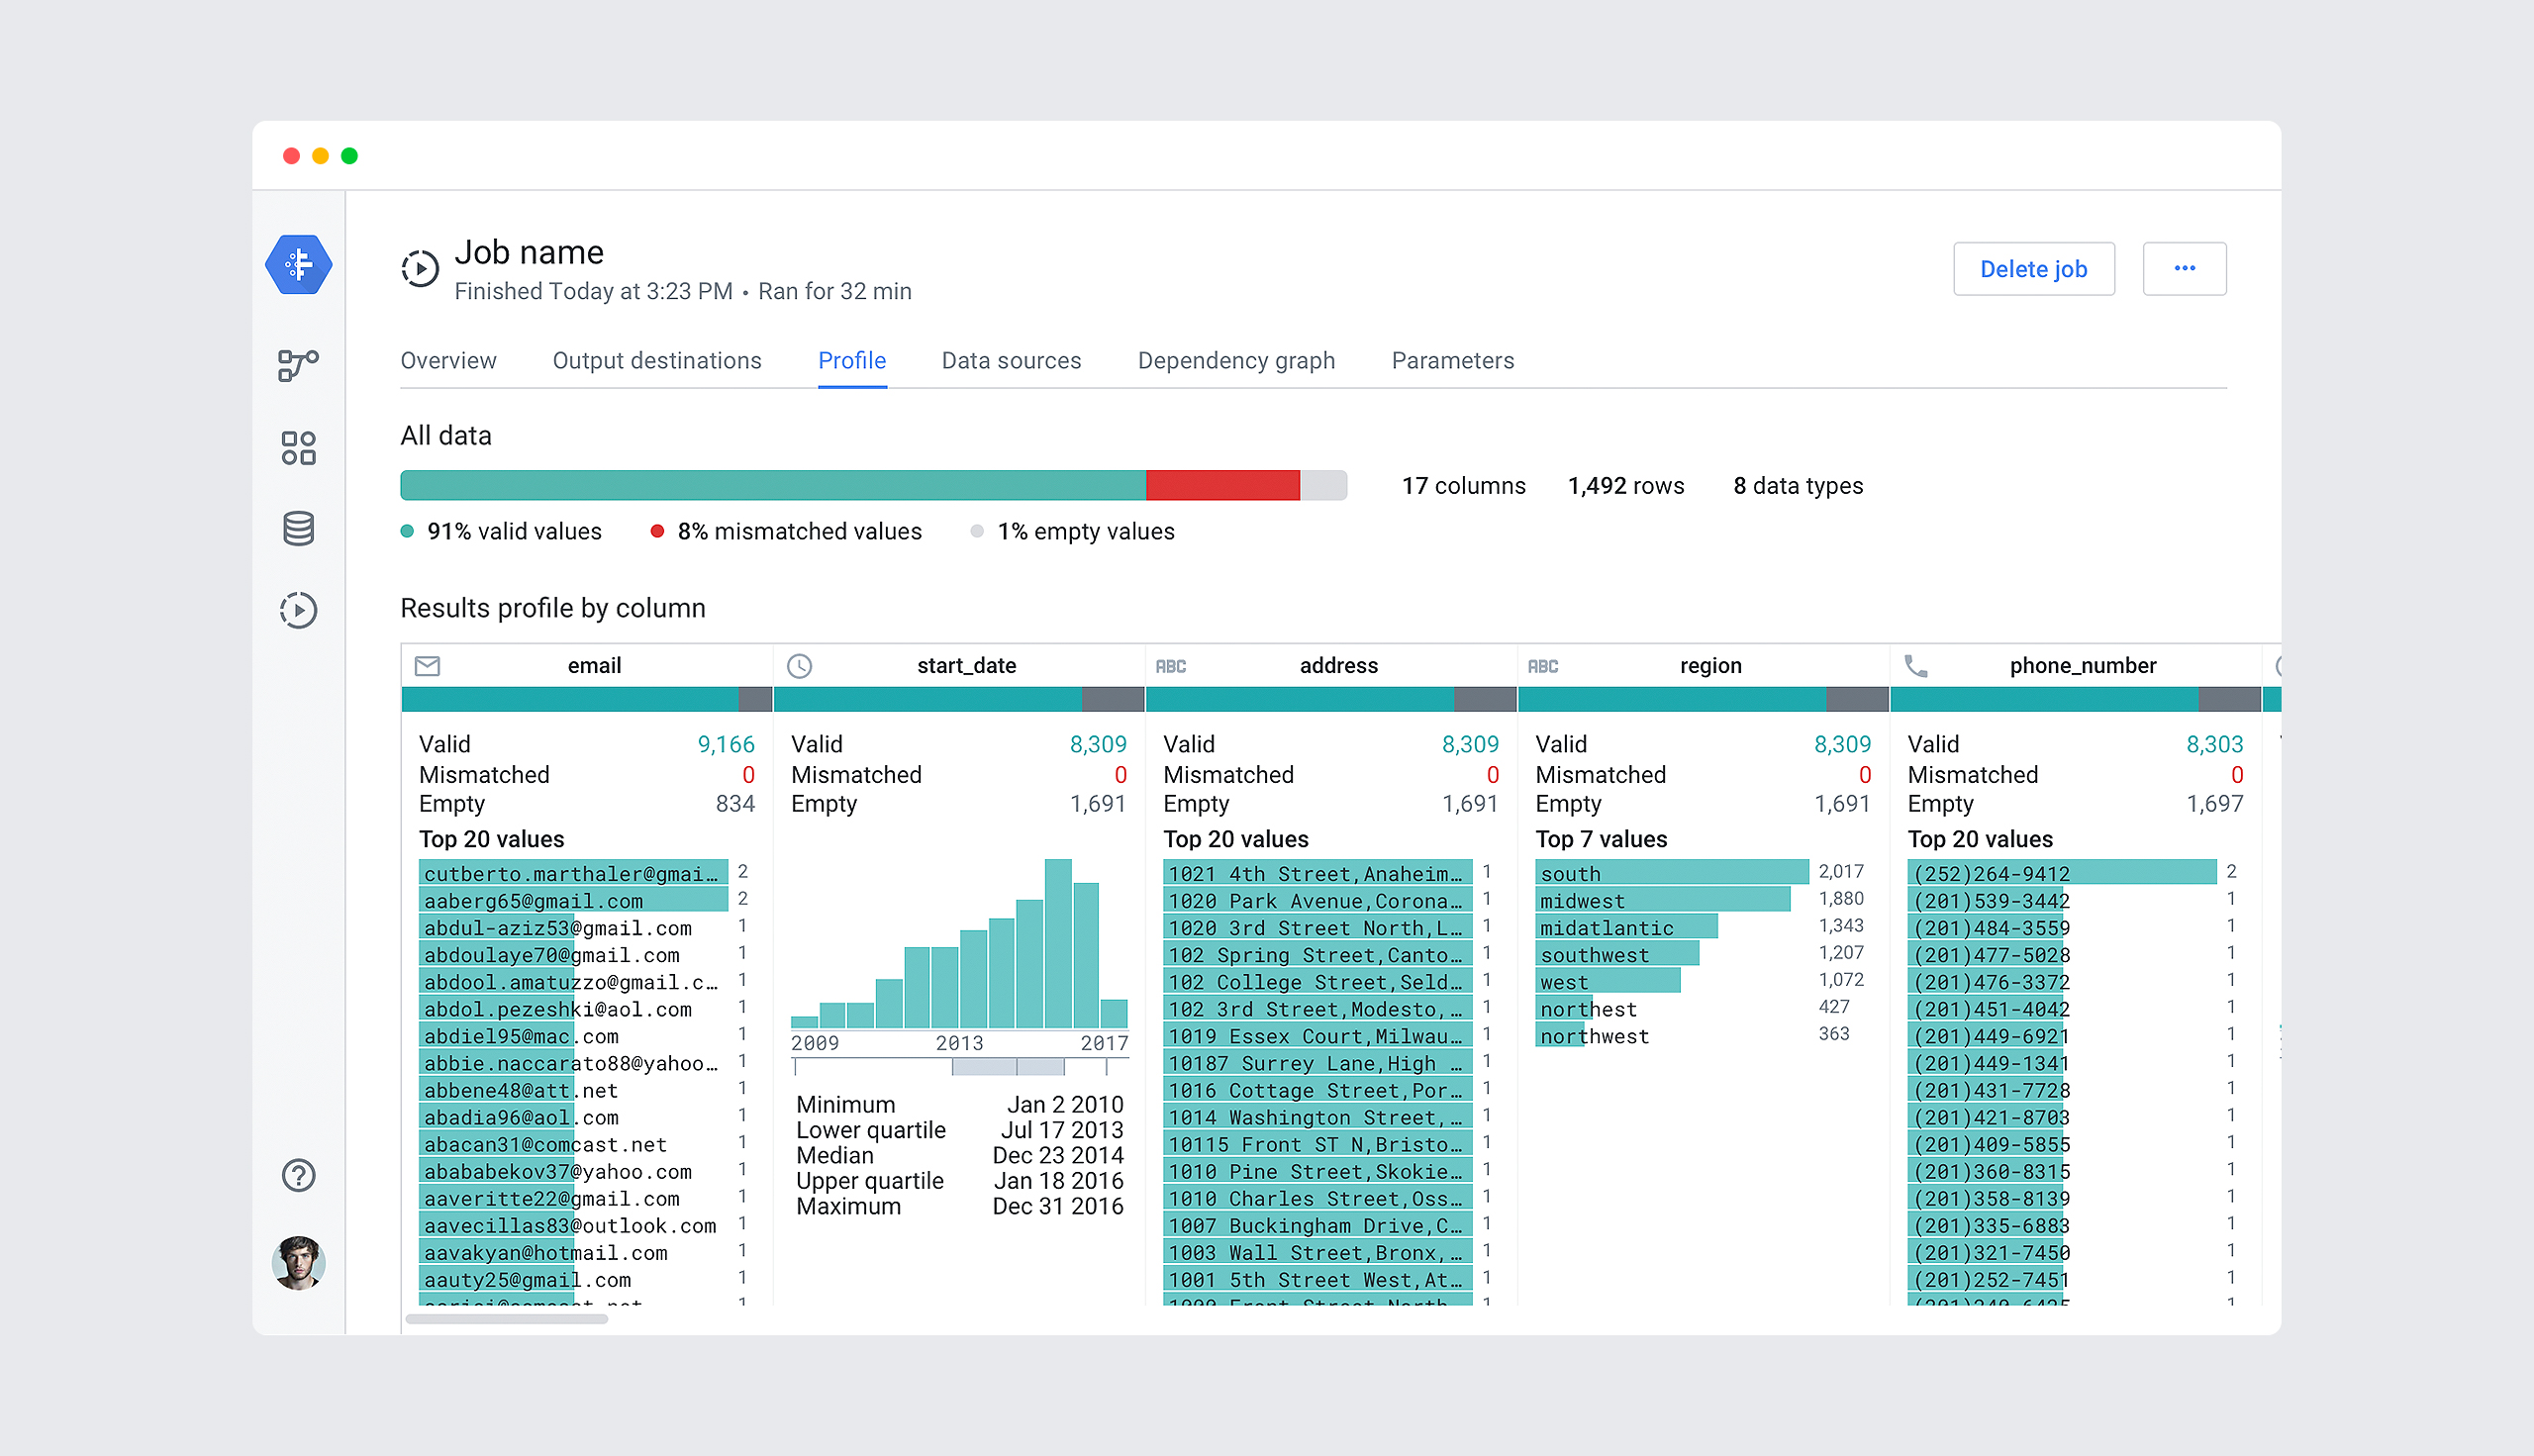
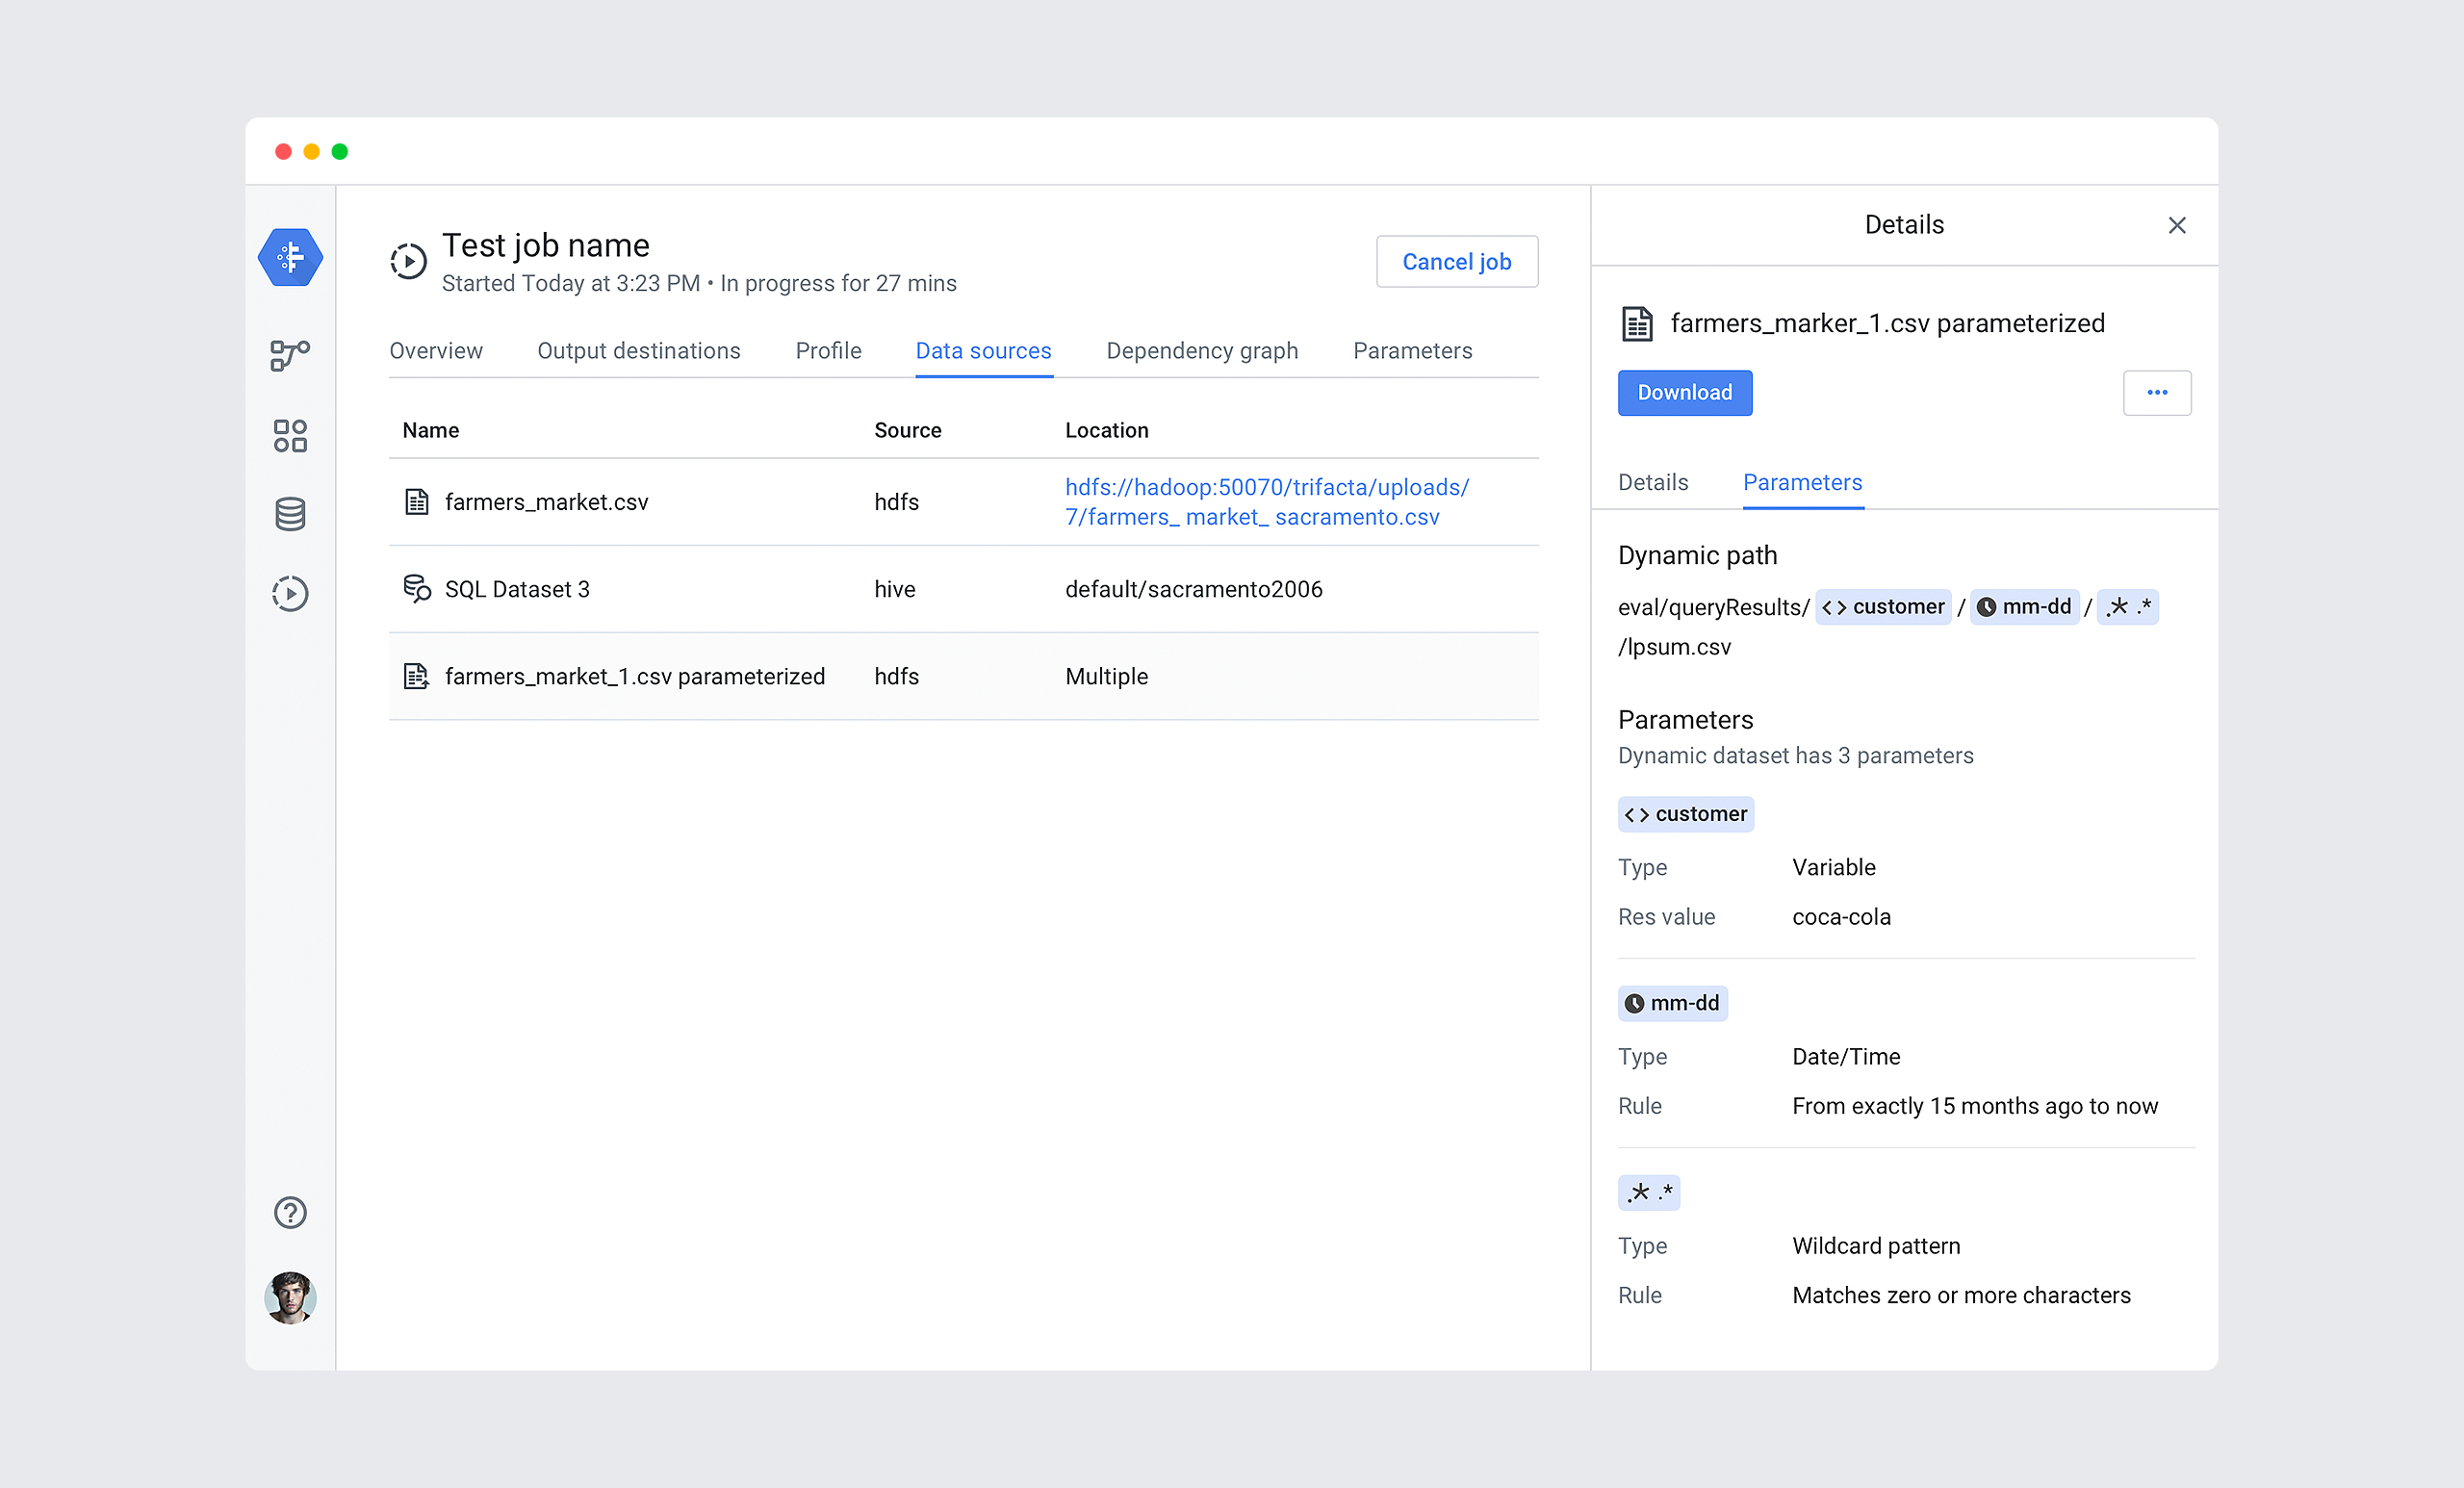
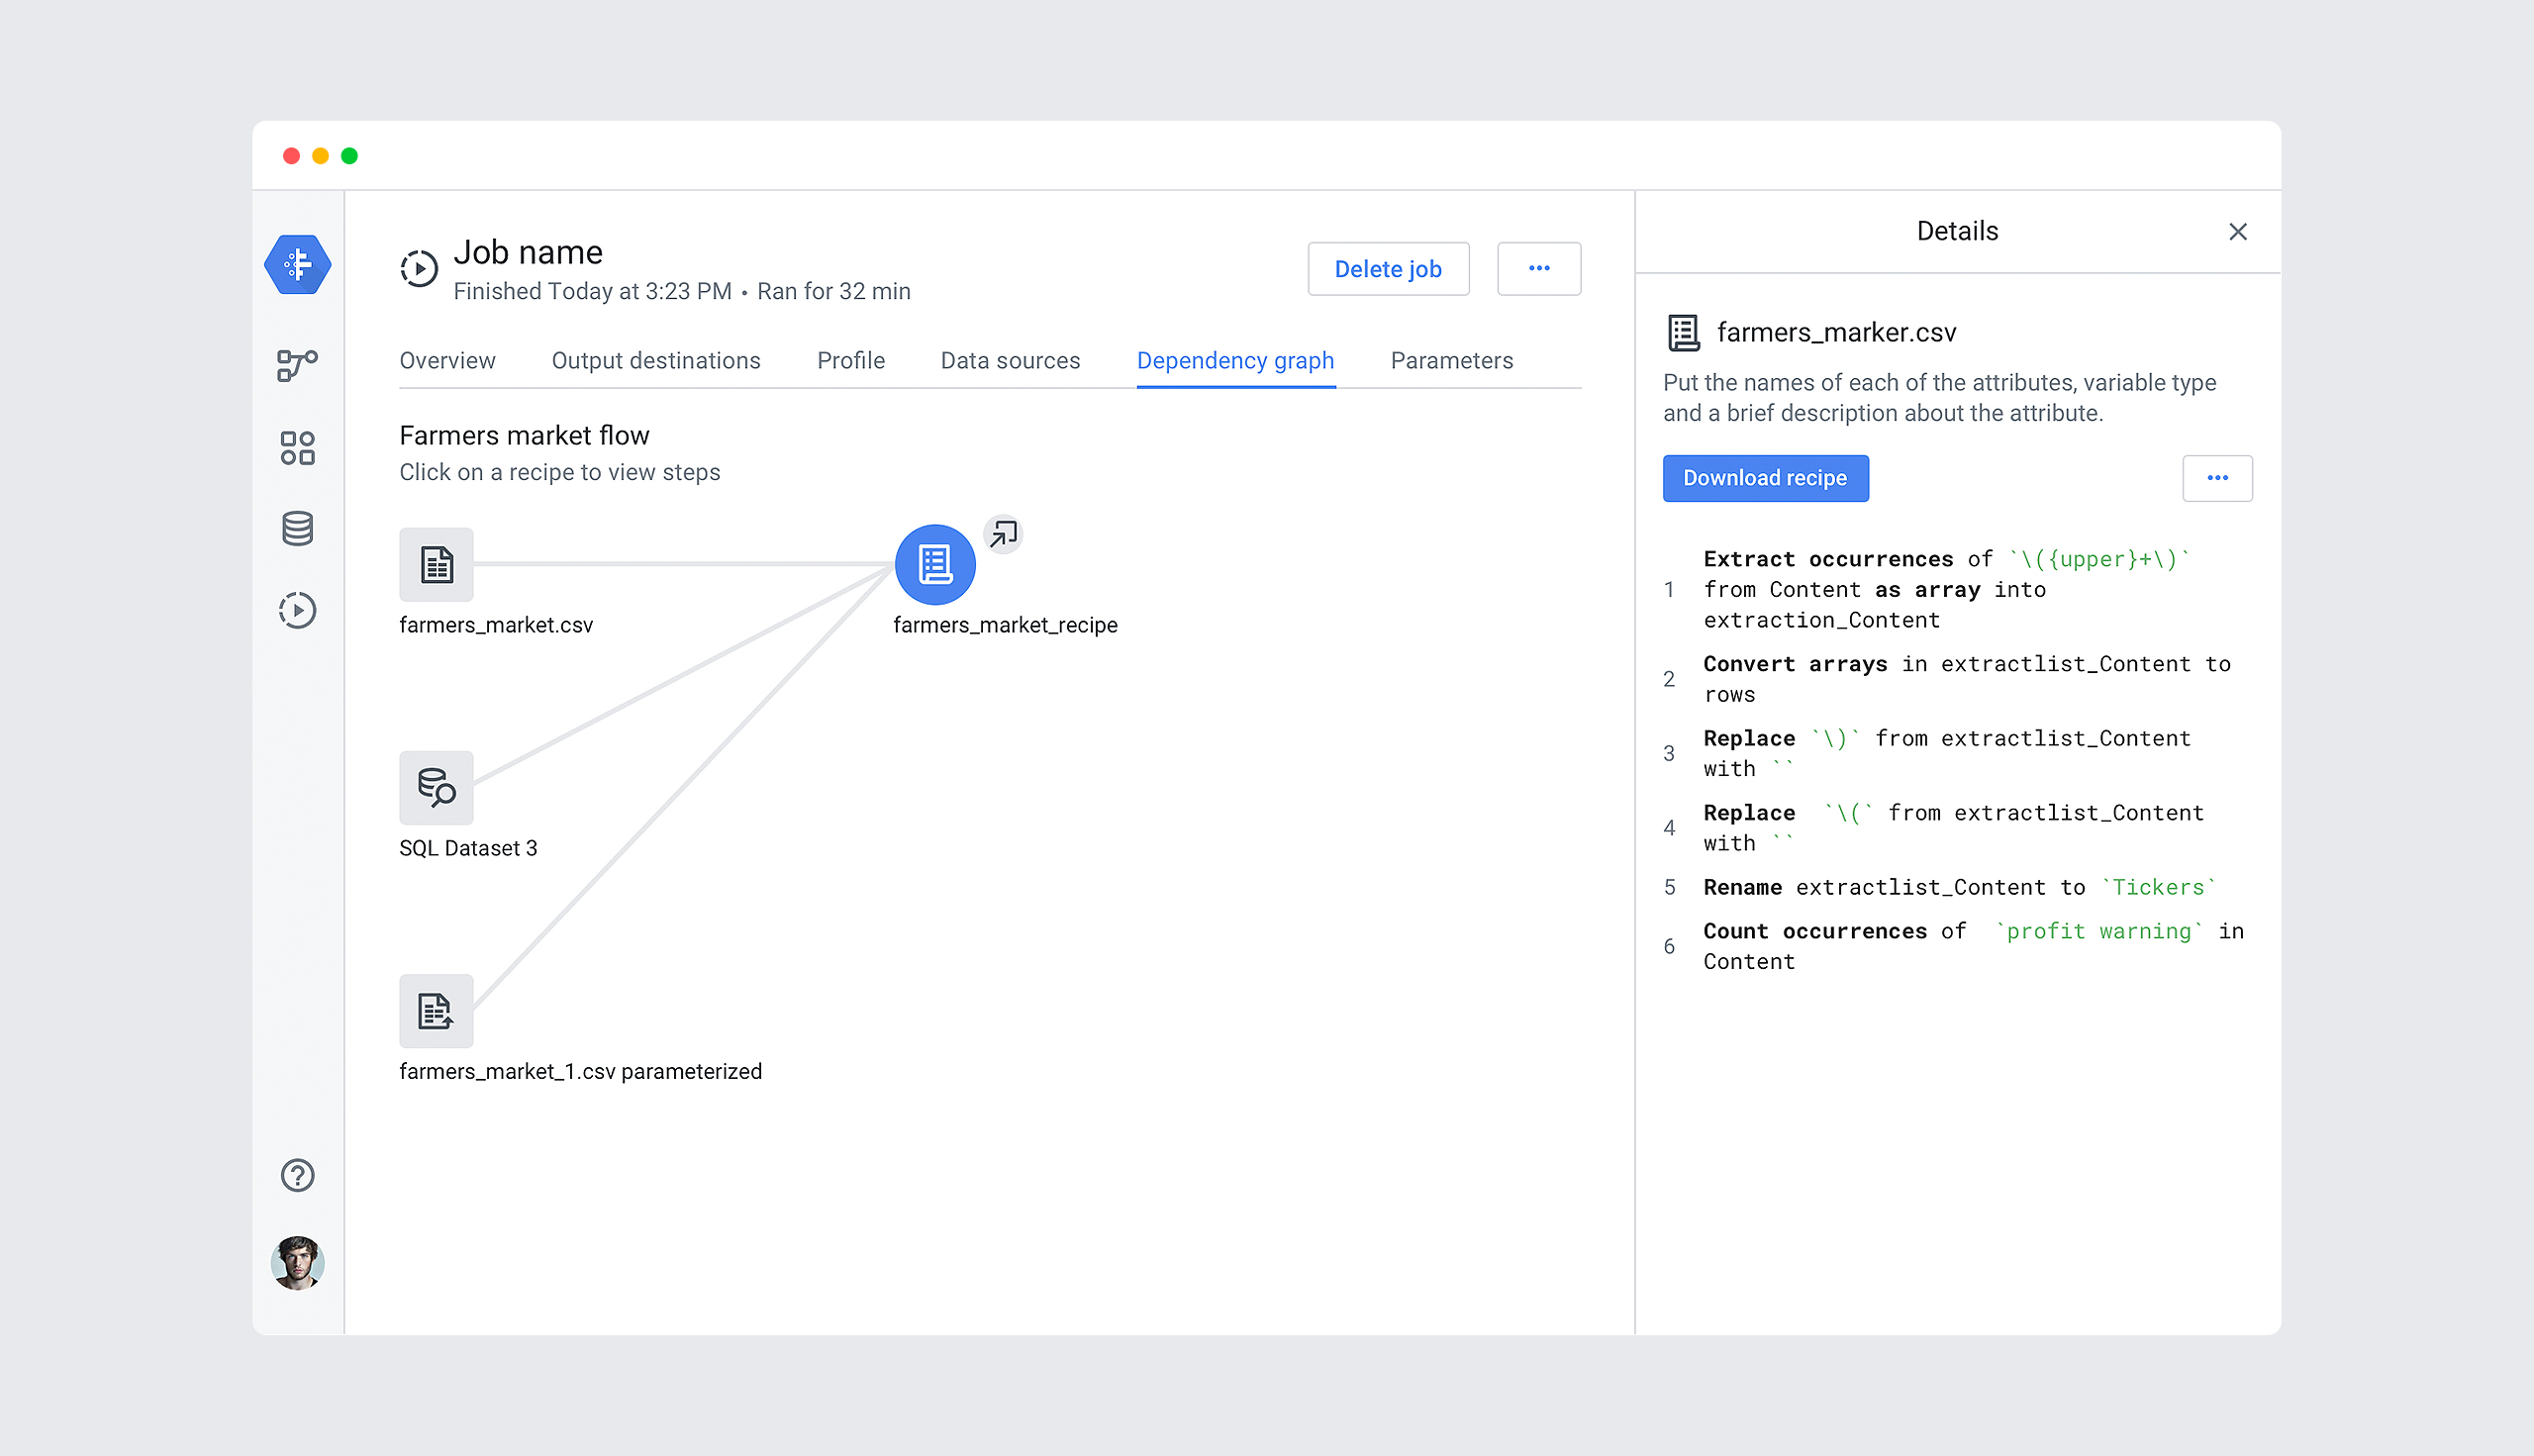
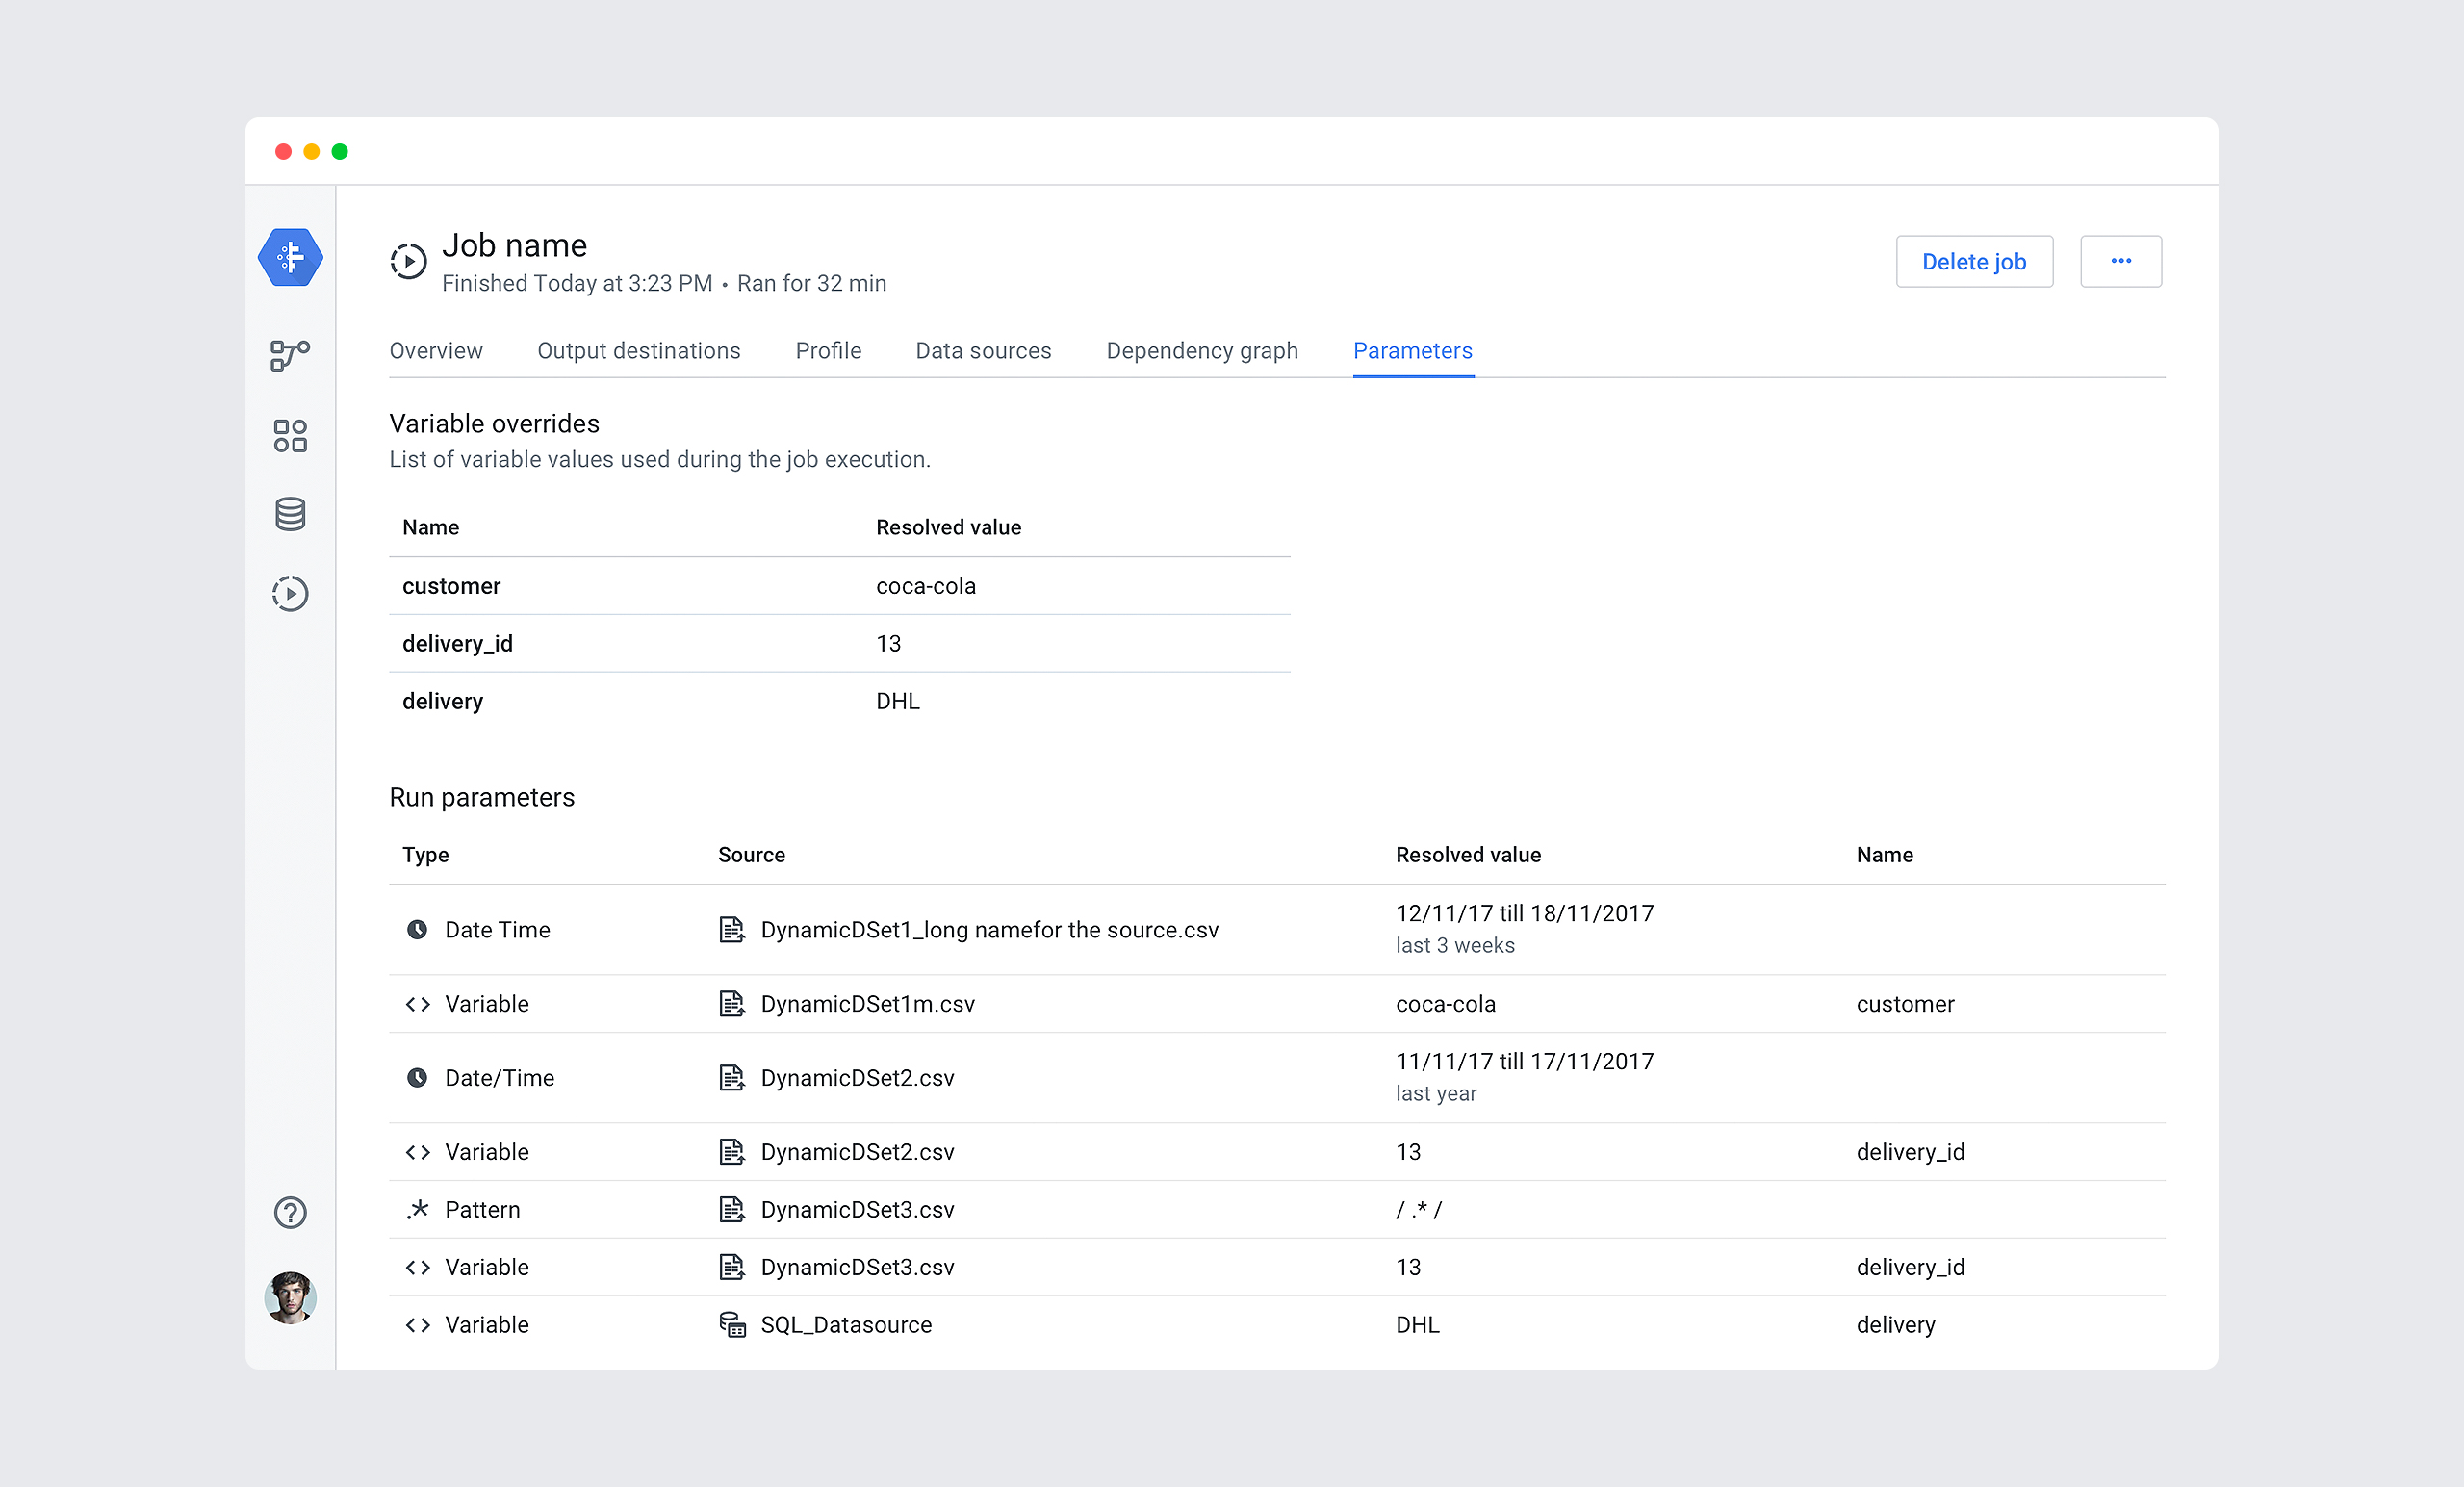
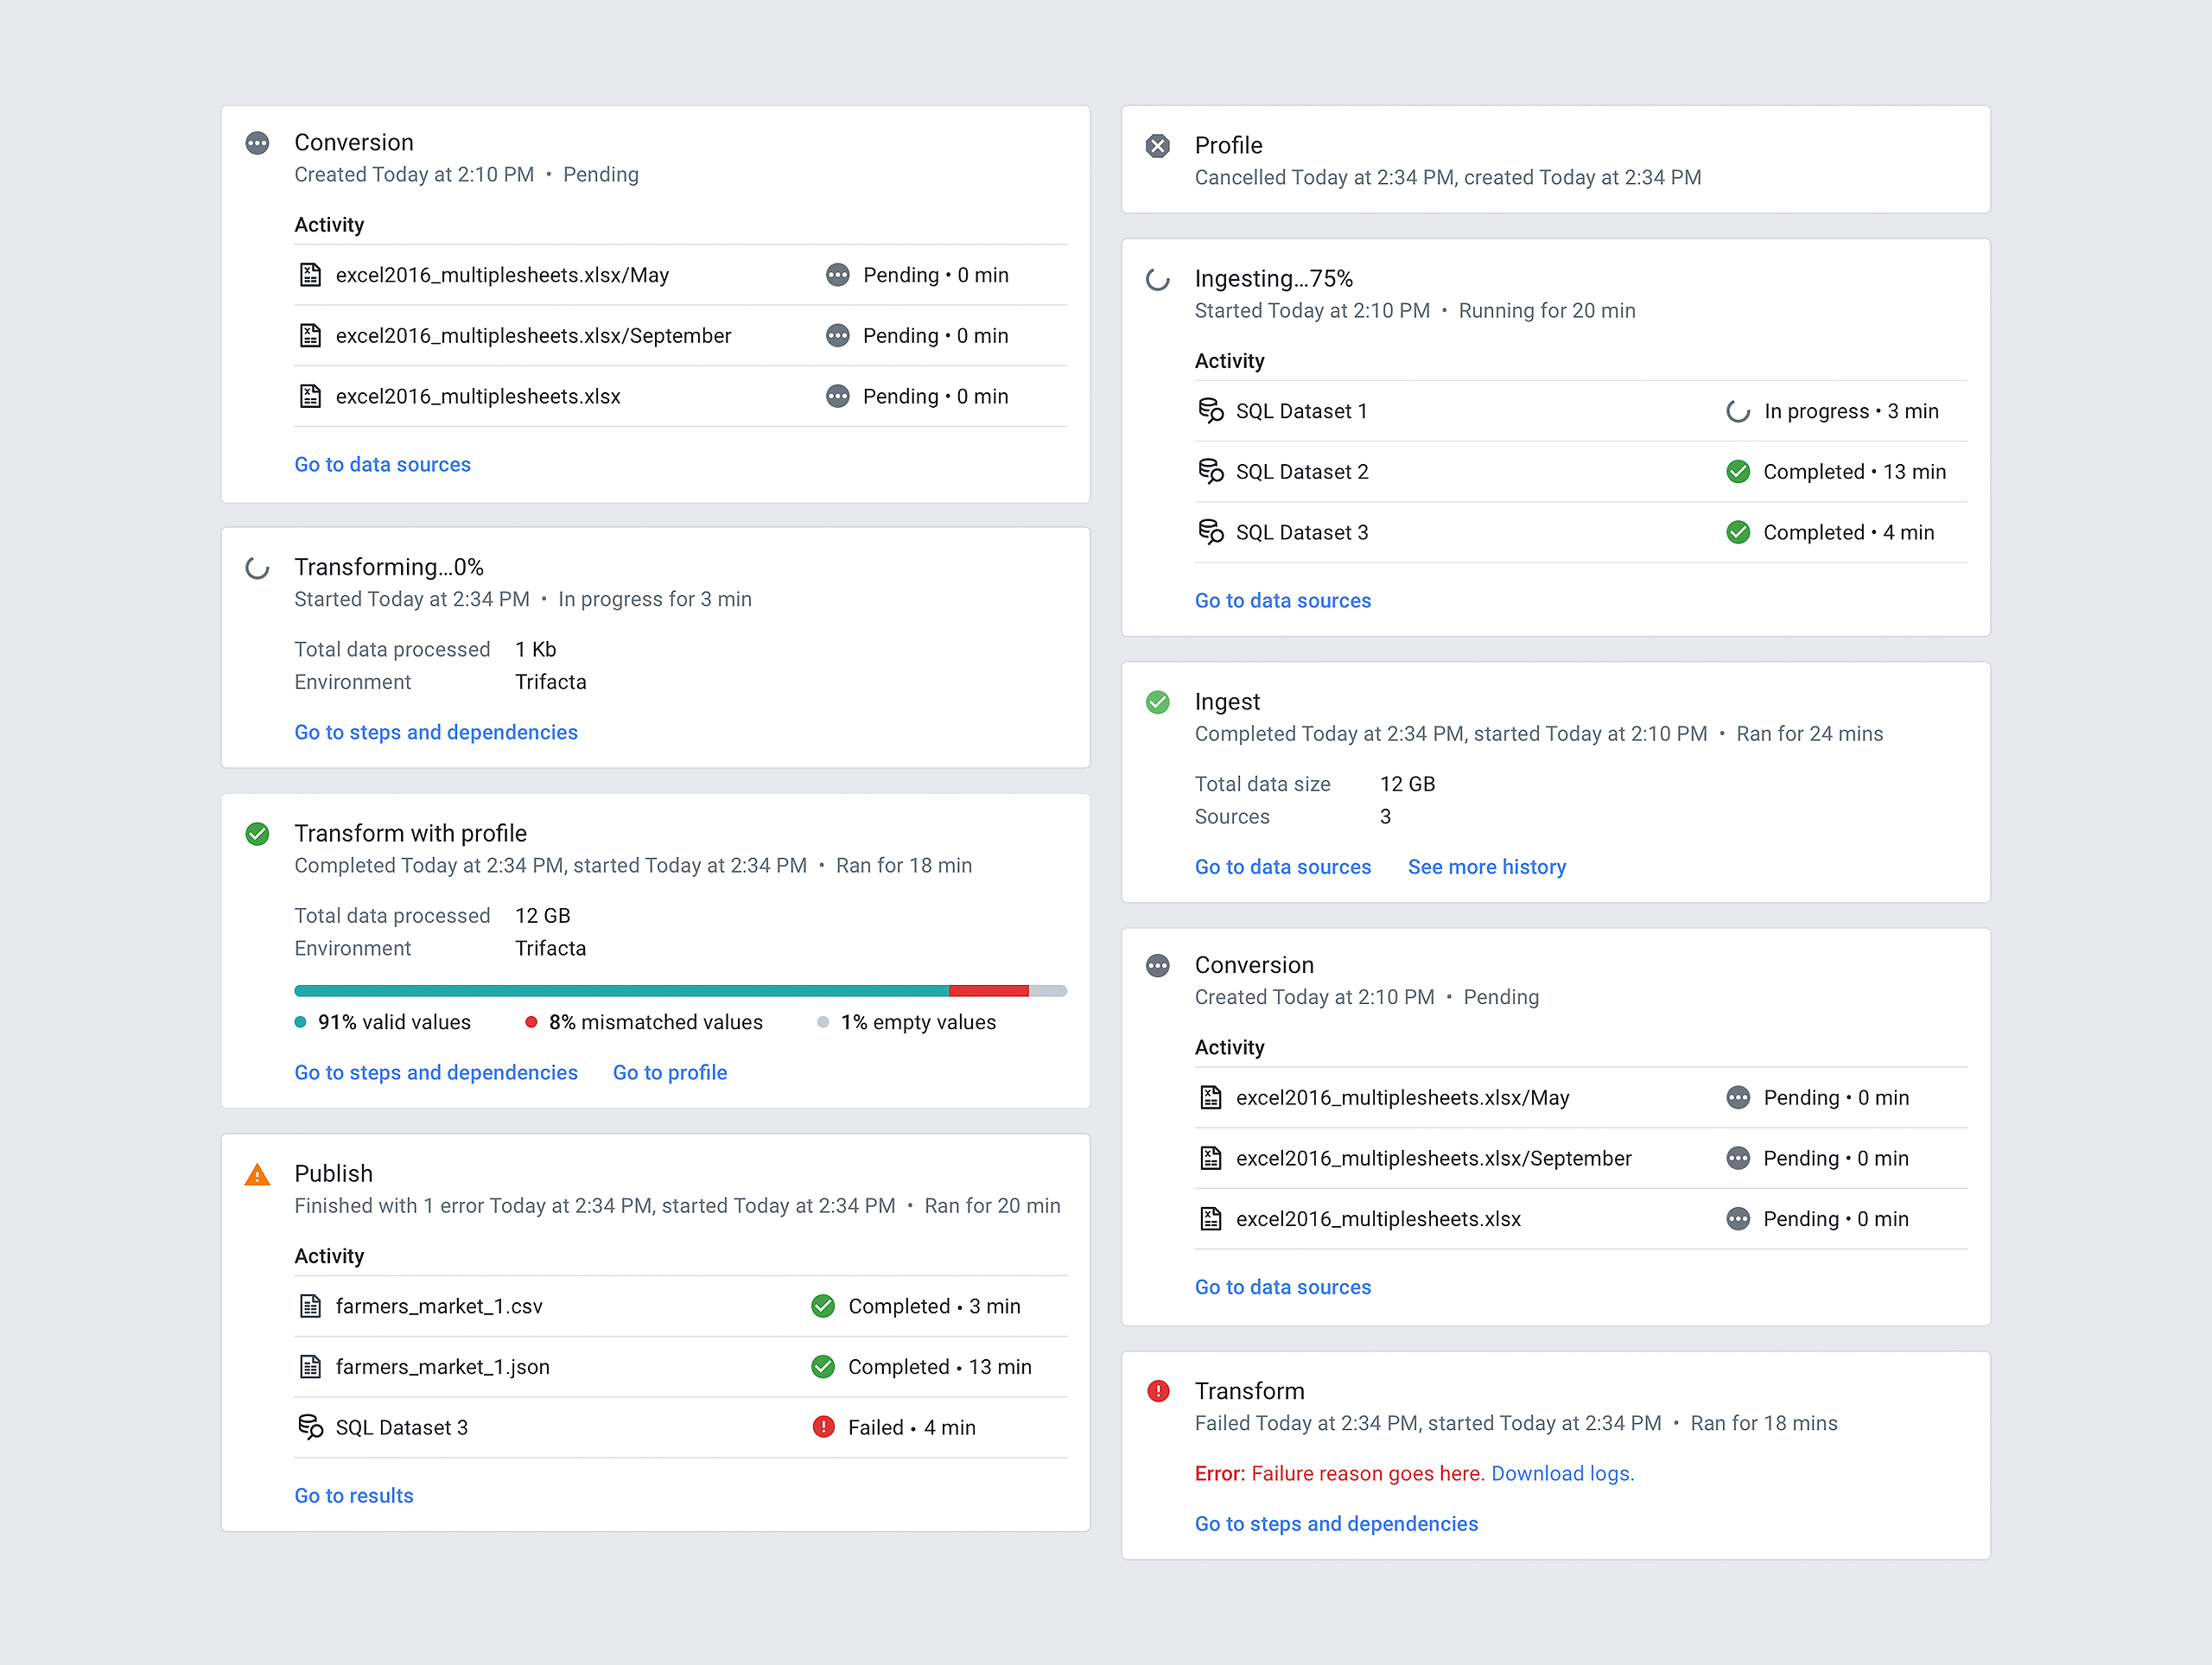
Final deliverables
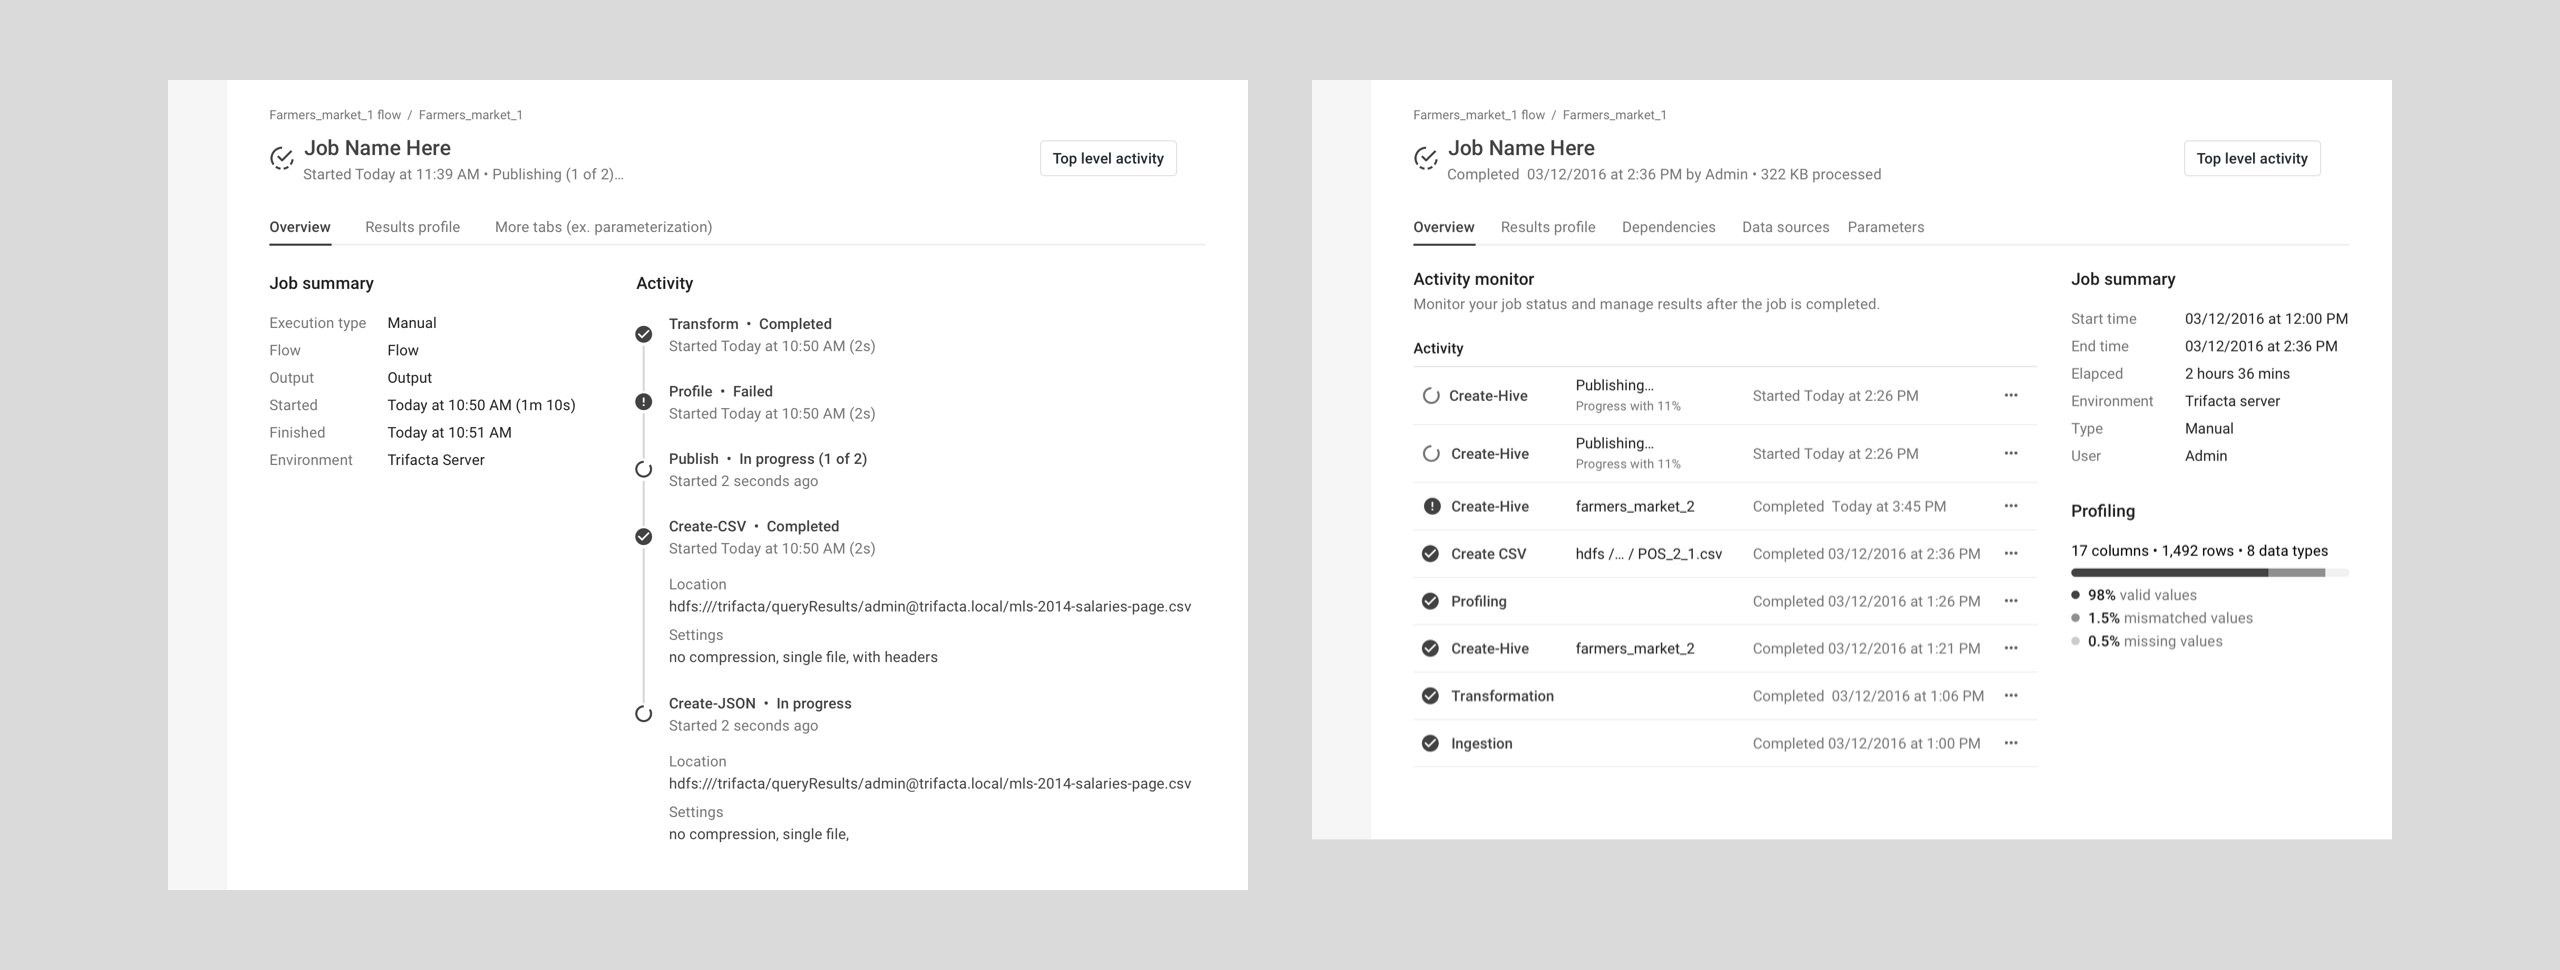
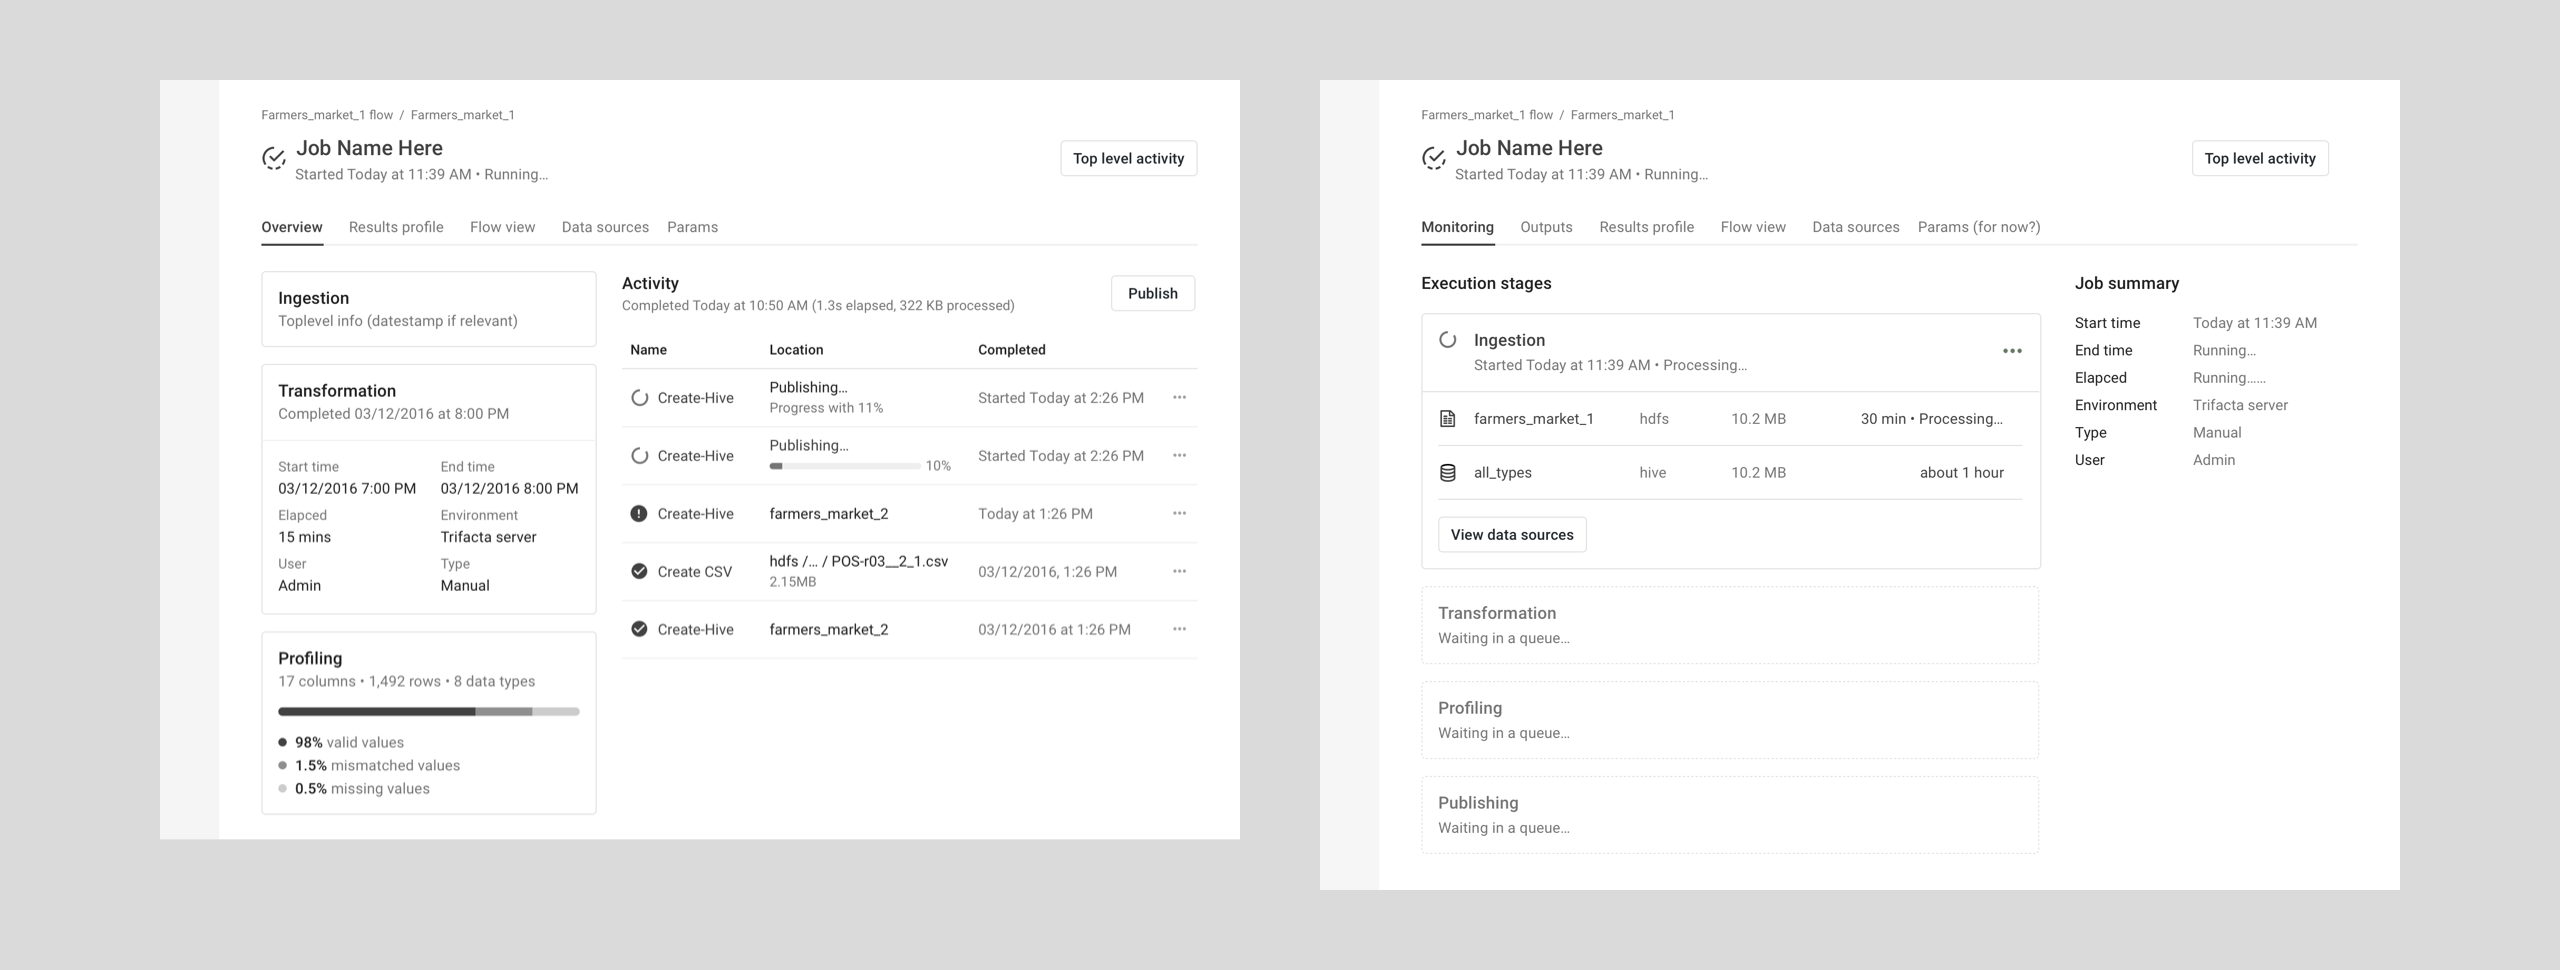
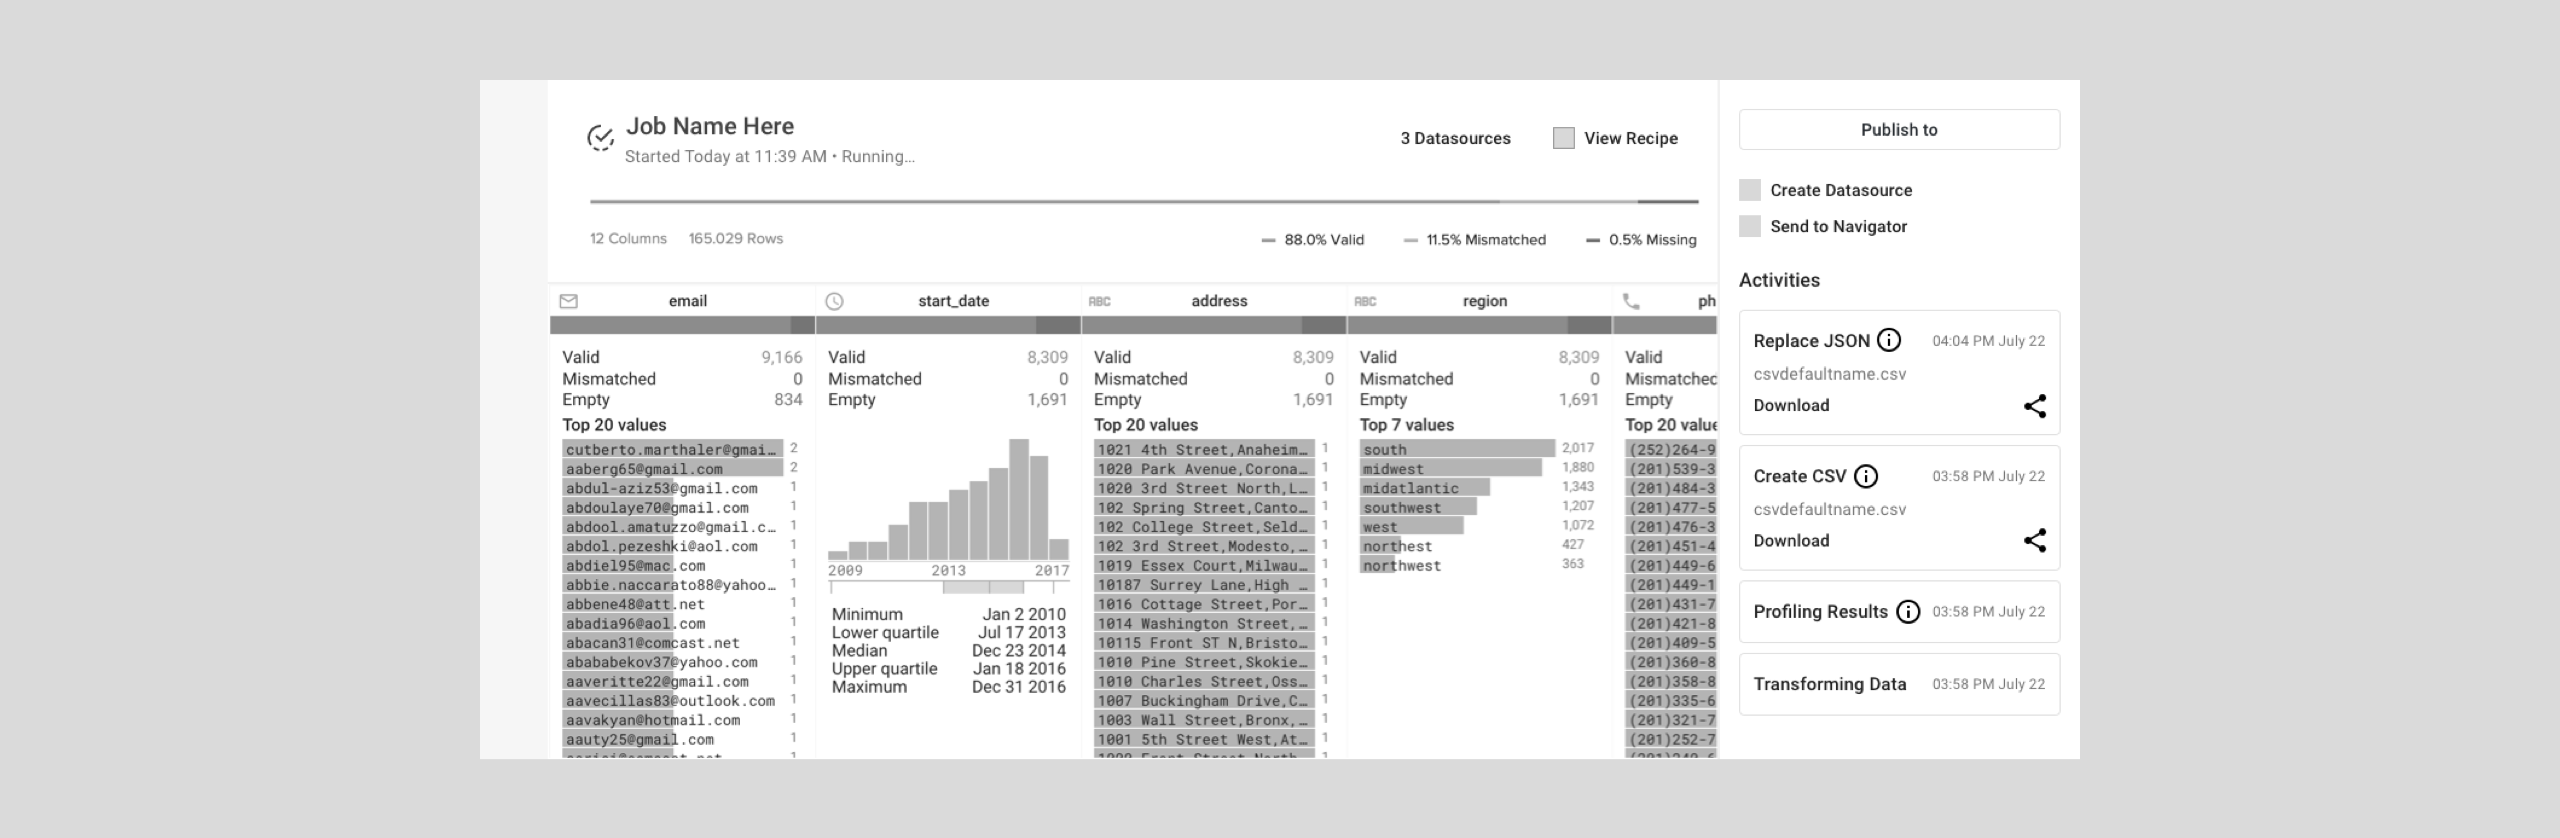
After a job is launched, detailed monitoring permits customers to track the process of the job during all phases of execution. Status, job stats, inputs, outputs, and a flow snapshot are available through the Trifacta application.
Designed with love in San Francisco
Designed with love in San Francisco
Designed with love in San Francisco